 Permanecer
Condiciones de negociación
Products
Herramientas


Existing home sales in the United States declined 4.1% in October, reaching 3.79 million—the lowest figure since August 2010.
The reduction has been recorded for the fifth consecutive month and was caused by the rise in mortgage rates and housing prices.
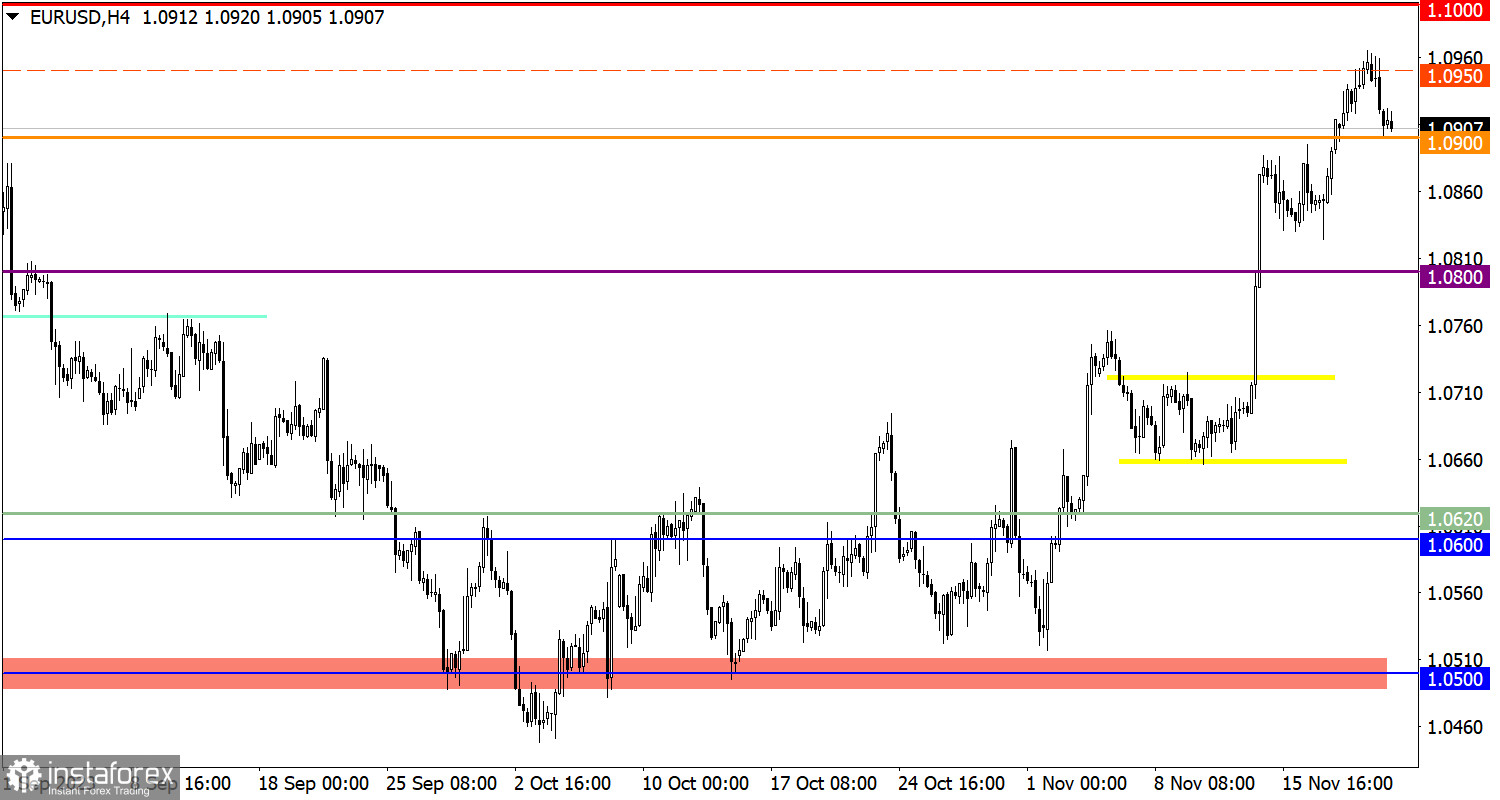
The EUR/USD currency pair, in the course of inertial-speculative movement, reached the lower range of the psychological level of 1.0950/1.1000. As a result, there was a reduction in the volume of long positions, leading to a price pullback. This movement is considered justified in the market due to the overbought status of the euro.
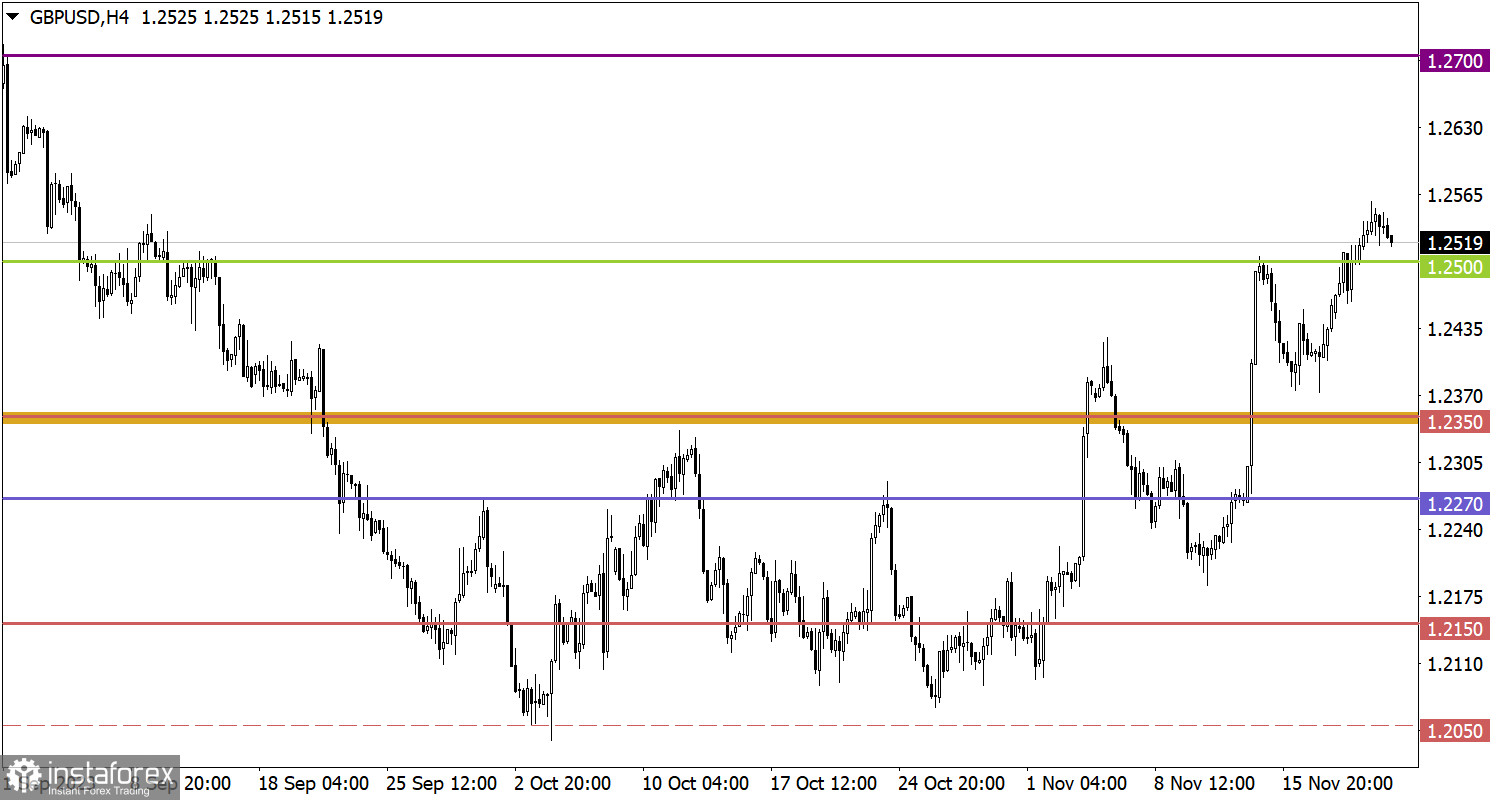
The GBP/USD pair reached the level of 1.2550, but due to an obvious technical signal of overbought conditions, a reduction in the volume of long positions could be observed, primarily leading to a slowdown in the upward cycle, and then to a pullback.

Today, the publication of data on orders for durable goods in the United States is expected, with an anticipated decrease of 2.8%. In addition, the overall number of unemployment benefit claims may rise by 5,000. In general, there is nothing positive, and everything indicates further weakening of the dollar. However, tomorrow is a holiday in the United States for Thanksgiving, and this may lead to the fixation of trading positions in favor of the dollar; in this case, negative statistics will not affect the market.
To further increase the volume of short positions, it is necessary to keep the price below the level of 1.0900. In this case, a transition from the pullback stage to a full-scale correction is possible. An alternative scenario considers a reduction in the volume of short positions around the level of 1.0900, treating it as support. In this scenario, another attempt to break the psychological level of 1.1000 is possible.
In the case of further building a pullback stage, the quote can at least drop to the level of 1.2500. The subsequent price movement will depend on how market participants behave near this level. Two possible scenarios will be considered. The first is based on the rebound tactic, where the level of 1.2500 will be played as support, strengthening long positions. The second scenario considers a transition from the pullback stage to a full-scale correction. In this case, the level of 1.2500 will be broken.
The candlestick chart type is white and black graphic rectangles with lines above and below. With a detailed analysis of each individual candle, you can see its characteristics relative to a particular time frame: opening price, closing price, intraday high and low.
Horizontal levels are price coordinates, relative to which a price may stop or reverse its trajectory. In the market, these levels are called support and resistance.
Circles and rectangles are highlighted examples where the price reversed in history. This color highlighting indicates horizontal lines that may put pressure on the asset's price in the future.
The up/down arrows are landmarks of the possible price direction in the future.
¡Los informes analíticos de InstaForex lo mantendrá bien informado de las tendencias del mercado! Al ser un cliente de InstaForex, se le proporciona una gran cantidad de servicios gratuitos para una operación eficiente.
Your IP address shows that you are currently located in the USA. If you are a resident of the United States, you are prohibited from using the services of Instant Trading EU Ltd including online trading, online transfers, deposit/withdrawal of funds, etc.
If you think you are seeing this message by mistake and your location is not the US, kindly proceed to the website. Otherwise, you must leave the website in order to comply with government restrictions.
Why does your IP address show your location as the USA?
Please confirm whether you are a US resident or not by clicking the relevant button below. If you choose the wrong option, being a US resident, you will not be able to open an account with InstaForex anyway.
We are sorry for any inconvenience caused by this message.


