 Permanecer
Condiciones de negociación
Products
Herramientas


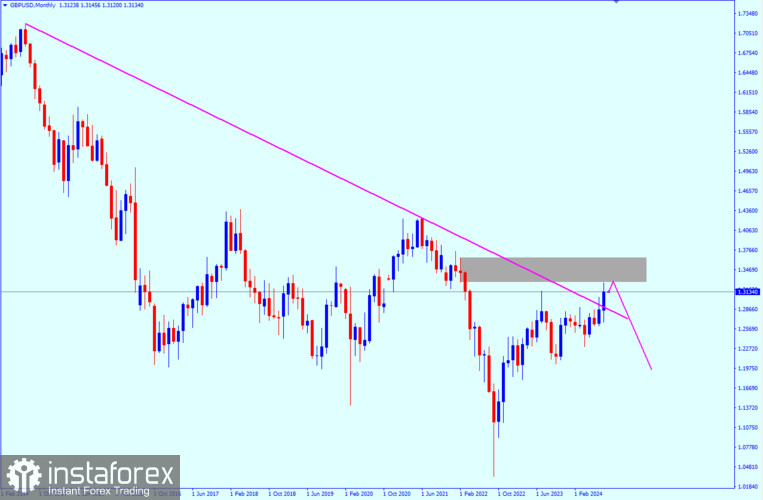
Monthly chart
In the monthly time frame, the GBP/USD pair broke a downtrend line that lasted for more than 10 years. However, this break could be false and GBP/USD will not be able to continue rising after this break. It is targeting liquidity above the trend line and will rebound from the order zone at 1.3280. From this area, we may see some bearish signals such as price action or a bearish structure.
Weekly chart
The weekly time frame also supports the decline because the trend is still bearish and there is an additional signal that supports the decline from the order block of 1.3488, which is the presence of an IDM before this level. The IDM is like liquidity that attracts traders to enter from areas before the real bounce happens, and the GBP/USD pair will target breaking the internal upward trend.
Daily chart
There are not many opportunities in the daily time frame, but there is a liquidity void, which is a sign that the pair needs to make some corrections before continuing the rise. This is actually a good sign to target the order block on the weekly time frame. To reach that order block, the instrument will bounce from 1.2871 (order block) or from the 61.8 Fibonacci level. These are considered important levels for the bounce, and then we will see a strong rise after that.
4-hour chart
If you want to enter a trade until the price reaches the appropriate areas in the daily time frame, there is a good area to enter sell from the level of 1.31642. This area is considered an order flow zone, as the price bounced from the order block above it, and then I expect it to do the same thing from this zone, especially since a Shift in Structure occurred. This is a good signal for the start of the downward trend in the four hours.
Points of interest (POI)
Sell from: 1.31642 (from OB with the Order flow)
TP 1: 1.30537 (maybe will rebound from there)
TP 2: 1.2900 (will continue the bullish movements in the daily)
Stop loss: 1.3200 (above the OB)
¡Los informes analíticos de InstaForex lo mantendrá bien informado de las tendencias del mercado! Al ser un cliente de InstaForex, se le proporciona una gran cantidad de servicios gratuitos para una operación eficiente.


