 Permanecer
Condiciones de negociación
Products
Herramientas


Trend-following analysis
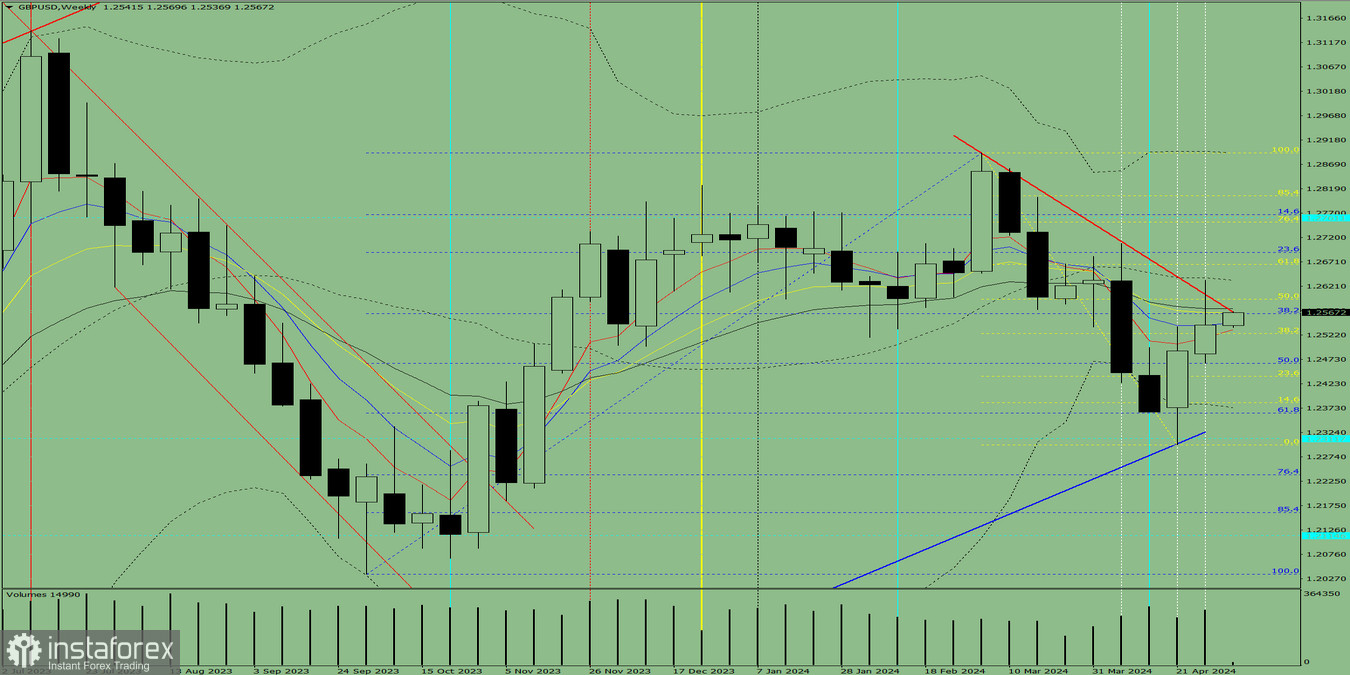
This week, from 1.2542, the closing level of the last weekly candle, GBP/USD may continue to move upward with a target of 1.2665, the retracement level of 61.8% plotted by the yellow dotted line. Once this level is reached, the price will most likely continue to move upward with a target of 1.2690, a retracement level of 23.6% plotted by the blue dotted line.
Complex analysis
Indicator analysis – up
Fibonacci levels – up
Trading volume – up
Candlestick analysis – up
Trend-following analysis – down
Bollinger bands – down
One-month chart – up
Conclusion of complex analysis: upward move
The result of evaluating the GBP/USD pair's candlestick on the weekly chart: this week, the instrument will most likely follow an uptrend, suggested by the absence of the first lower shadow of the weekly white candle (Monday - up) and the absence of the second upper shadow (Friday - up).
From 1.2542, the closing level of the last weekly candle, the price may continue to move upward with a target of 1.2665, the retracement level of 61.8% plotted by the yellow dotted line. After this level is reached, the instrument will most likely continue to move upward with a target of 1.2690, a retracement level of 23.6% plotted by the blue dotted line.
According to an alternative scenario, from 1.2542, the closing level of the last weekly candle, GBP/USD may begin to move upward with a target of 1.2665, the retracement level of 61.8% plotted by the yellow dotted line. Once this level is reached, the price may pull back down with a target of 1.2594, the 50% retracement level represented by the yellow dotted line.
¡Los informes analíticos de InstaForex lo mantendrá bien informado de las tendencias del mercado! Al ser un cliente de InstaForex, se le proporciona una gran cantidad de servicios gratuitos para una operación eficiente.


