 Permanecer
Condiciones de negociación
Products
Herramientas


GBP/USD continued to trade lower and also failed to overcome the important support level of 1.2633. The British currency did not fall on macroeconomic reports; in fact, two out of the three key reports of the day in the UK exceeded both forecasts and previous values. We are talking about the Manufacturing PMI data and the retail sales report. The pound should have continued to fall during the US trading session, as both business activity indices in the US turned out to be better than expected, but it didn't. Another day with the British currency showing the same movements.
Also, we would like to remind you that the results of the Bank of England meeting were announced on Thursday, which cannot be considered dovish. If they were hawkish, then the British pound should have shown growth, not a decline. But, as we have already mentioned, there is no logic behind the pound's movements right now.
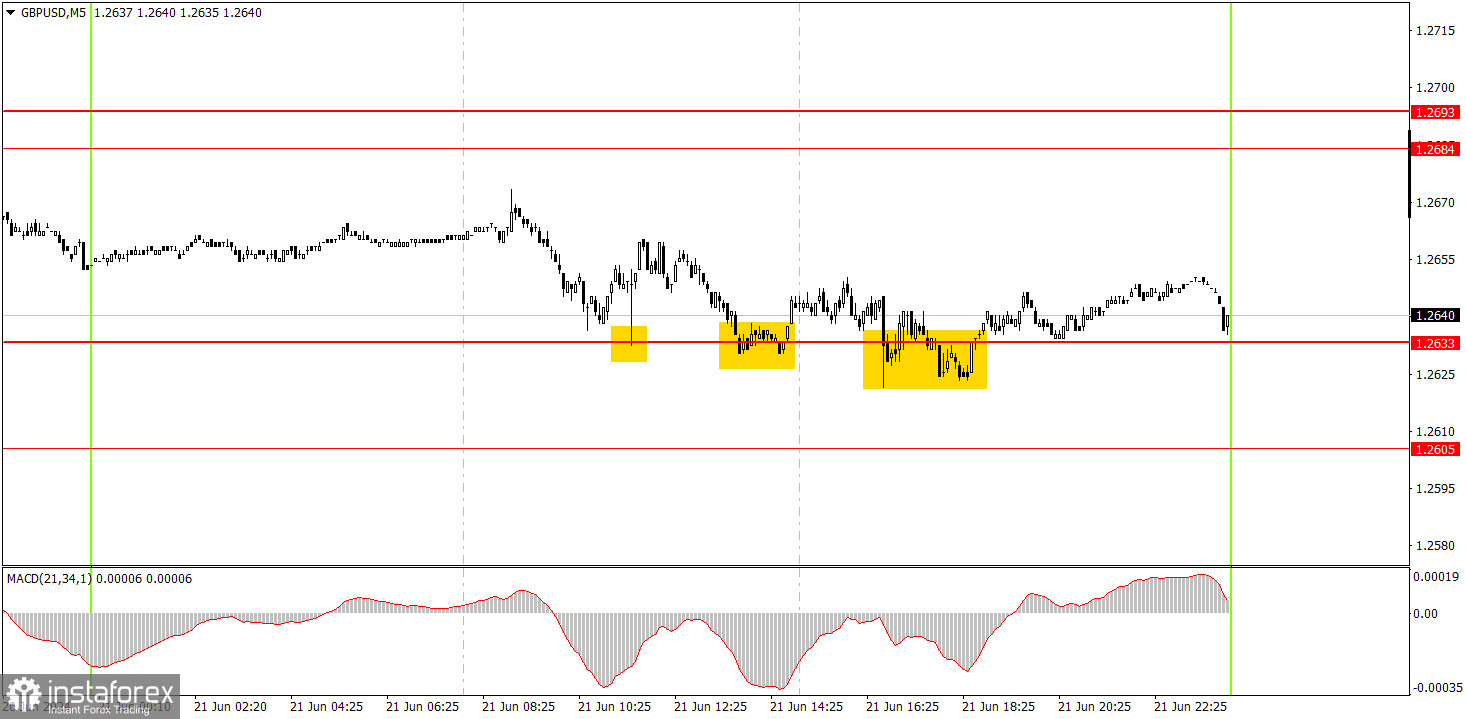
The pair moved in a chaotic manner on the 5-minute timeframe, constantly changing direction, and overall, volatility was just 52 pips. Novice traders could have stayed in short positions since Thursday, as the price overcame the range of 1.2684-1.2693. We usually do not recommend carrying intraday trades to the next day, but at that time, volatility was so low that there was simply no other option. Three buy signals were formed on Friday. The first two did not lead to significant upward movement, and the third was so inaccurate that it should not have been executed.
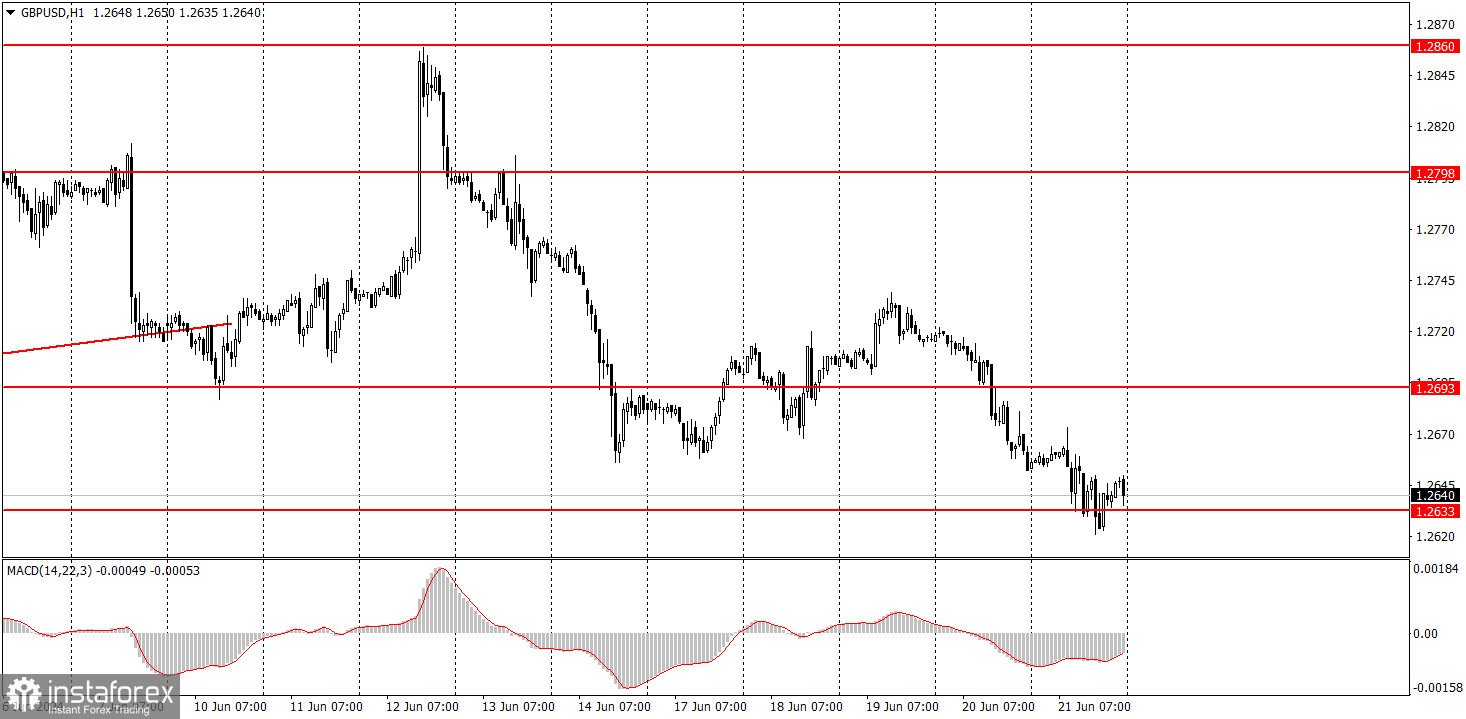
On the hourly chart, the GBP/USD pair continues to show promising signs of forming a downtrend, although the uptrend has not been invalidated, along with the monthly flat. In regards to the pair's bearish prospects, it's a good thing that the price managed to overcome the 1.2693 level twice; However, the market still frequently resists downward moves, even in the presence of technical, fundamental, and macroeconomic factors favoring such a direction. In addition, volatility is weak, and the pair shows illogical movements.
On Monday, the British pound may continue to exhibit erratic and illogical movements. The pair could go through low volatility again. In the current circumstances, GBP/USD has grounds to fall further, but the pair's movements within the day leave much to be desired.
The key levels on the 5M chart are 1.2457, 1.2502, 1.2541-1.2547, 1.2605-1.2633, 1.2684-1.2693, 1.2748, 1.2791-1.2798, 1.2848-1.2860, 1.2913, 1.2980. On Monday, there are no important events planned in the UK and the US. Therefore, traders will likely face another "boring Monday."
1) Signal strength is determined by the time taken for its formation (either a bounce or level breach). A shorter formation time indicates a stronger signal.
2) If two or more trades around a certain level are initiated based on false signals, subsequent signals from that level should be disregarded.
3) In a flat market, any currency pair can produce multiple false signals or none at all. In any case, the flat trend is not the best condition for trading.
4) Trading activities are confined between the onset of the European session and mid-way through the U.S. session, after which all open trades should be manually closed.
5) On the 30-minute timeframe, trades based on MACD signals are only advisable amidst substantial volatility and an established trend, confirmed either by a trendline or trend channel.
6) If two levels lie closely together (ranging from 5 to 15 pips apart), they should be considered as a support or resistance zone.
Support and Resistance price levels can serve as targets when buying or selling. You can place Take Profit levels near them.
Red lines represent channels or trend lines, depicting the current market trend and indicating the preferable trading direction.
The MACD(14,22,3) indicator, encompassing both the histogram and signal line, acts as an auxiliary tool and can also be used as a signal source.
Significant speeches and reports (always noted in the news calendar) can profoundly influence the price dynamics. Hence, trading during their release calls for heightened caution. It may be reasonable to exit the market to prevent abrupt price reversals against the prevailing trend.
Beginners should always remember that not every trade will yield profit. Establishing a clear strategy coupled with sound money management is the cornerstone of sustained trading success.
¡Los informes analíticos de InstaForex lo mantendrá bien informado de las tendencias del mercado! Al ser un cliente de InstaForex, se le proporciona una gran cantidad de servicios gratuitos para una operación eficiente.


