 Permanecer
Condiciones de negociación
Products
Herramientas


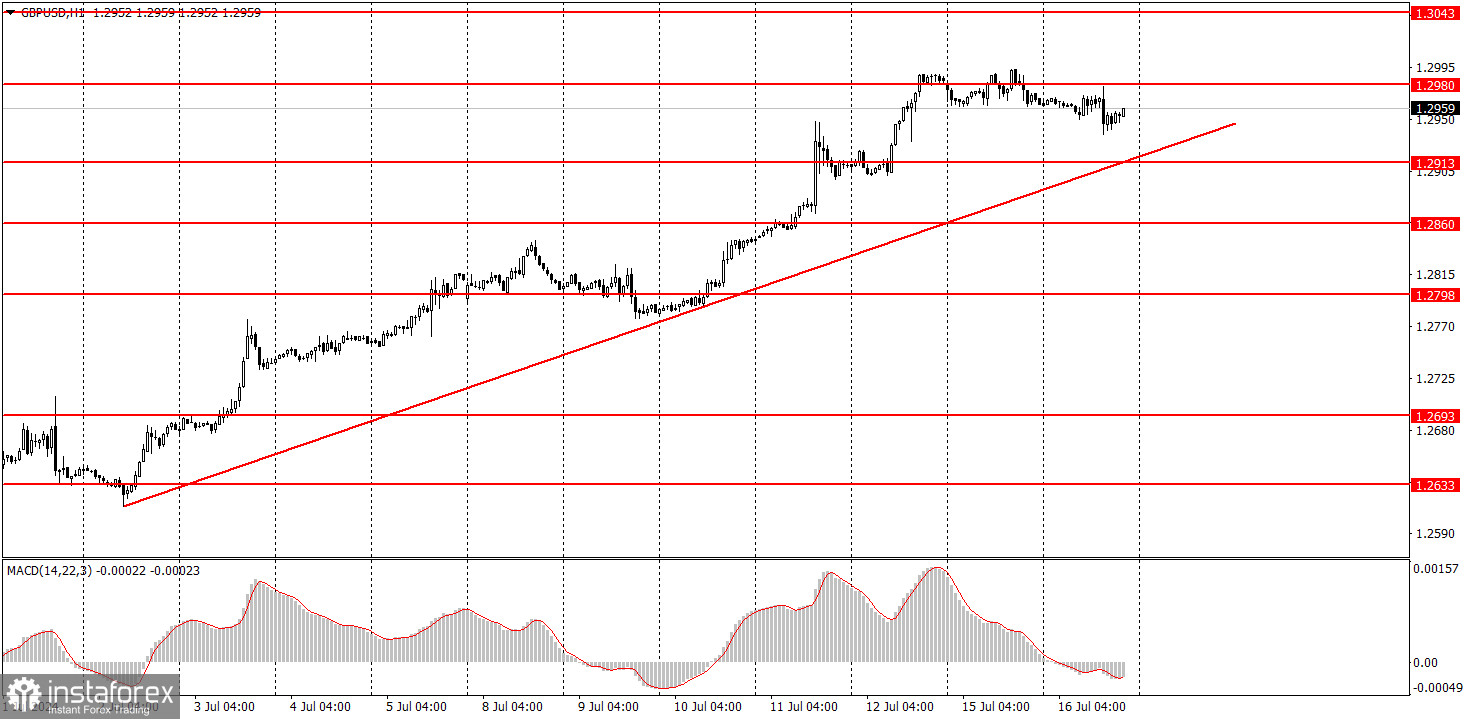
GBP/USD continued a sluggish downward correction to the ascending trend line. Since the price continues to be above the trend line, there is no reason to expect the pound to fall now. It may correct slightly to the downside, but the market remains firmly bullish. The market still finds reasons to buy the British currency, even when there is no reason for it. Yes, the pound has not started a new rise for the last two days, but that doesn't mean it's finished.
This week saw another hawkish speech from Federal Reserve Chief Jerome Powell, which did nothing to help the dollar. The U.S. retail sales report turned out to be stronger than forecasts, but it did not significantly boost the dollar. Volatility remains weak, the market does not want to sell the pound, even based on the fact that the Bank of England may start lowering rates as early as August.
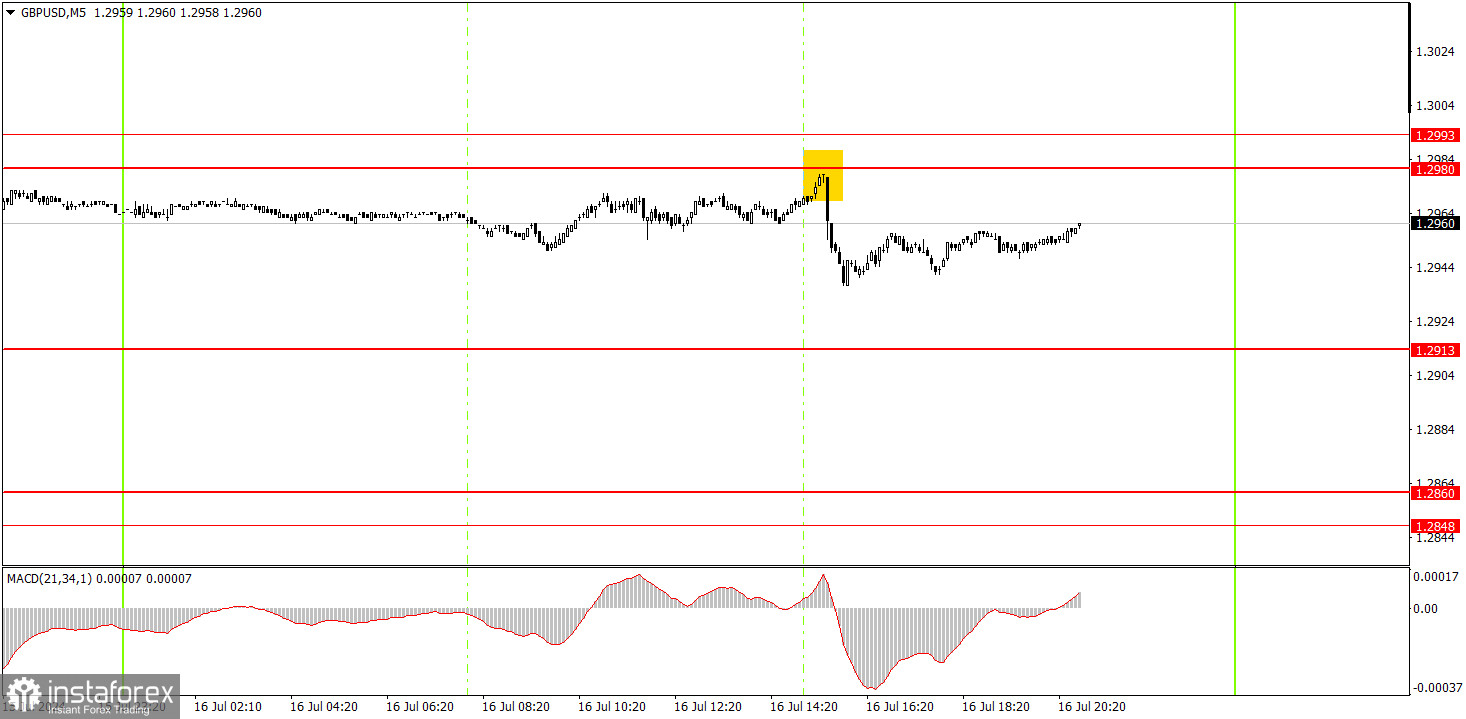
One sell signal was generated on the 5-minute timeframe, and novice traders were quite lucky. At the beginning of the U.S. session, the price came close to the level of 1.2988 and at that time the U.S. retail sales report was published, which slightly supported the dollar. As a result, the pair dropped 23 pips after the signal was formed, and managed to move up a little by the end of the day. This trade can be left open, since it is now impossible to count on generating a signal and working out at least the first target within a day.
On the hourly chart, GBP/USD continues to show promising signs of forming a downtrend, but this doesn't mean that the pair can't form an upward trend. The pair has been rising again, and overall, it continues to exhibit illogical movements. Currently, the pound sterling has surpassed its latest local high and continues to ignore the fundamental backdrop. However, no one can deny that the recent economic reports have been supporting the pound.
On Wednesday, the pound sterling may gradually fall towards the level of 1.2913. It may take several days to pass 45 pips. However, we don't expect a sharp decline unless the pound breaches the trend line. And even if it does, it might not happen altogether. This has been the case at least five times in recent months.
The key levels on the 5M chart are 1.2457, 1.2502, 1.2541-1.2547, 1.2605-1.2633, 1.2684-1.2693, 1.2748, 1.2791-1.2798, 1.2848-1, 2860, 1.2913, 1.2980. On Wednesday, the UK will publish an important inflation report for June, which could exert pressure on the pound as inflation could drop even lower. However, the market did not compensate for all previous drops in inflation by selling the pound.
1) Signal strength is determined by the time taken for its formation (either a bounce or level breach). A shorter formation time indicates a stronger signal.
2) If two or more trades around a certain level are initiated based on false signals, subsequent signals from that level should be disregarded.
3) In a flat market, any currency pair can produce multiple false signals or none at all. In any case, the flat trend is not the best condition for trading.
4) Trading activities are confined between the onset of the European session and mid-way through the U.S. session, after which all open trades should be manually closed.
5) On the 30-minute timeframe, trades based on MACD signals are only advisable amidst substantial volatility and an established trend, confirmed either by a trendline or trend channel.
6) If two levels lie closely together (ranging from 5 to 15 pips apart), they should be considered as a support or resistance zone.
Support and Resistance price levels can serve as targets when buying or selling. You can place Take Profit levels near them.
Red lines represent channels or trend lines, depicting the current market trend and indicating the preferable trading direction.
The MACD(14,22,3) indicator, encompassing both the histogram and signal line, acts as an auxiliary tool and can also be used as a signal source.
Significant speeches and reports (always noted in the news calendar) can profoundly influence the price dynamics. Hence, trading during their release calls for heightened caution. It may be reasonable to exit the market to prevent abrupt price reversals against the prevailing trend.
Beginners should always remember that not every trade will yield profit. Establishing a clear strategy coupled with sound money management is the cornerstone of sustained trading success.
¡Los informes analíticos de InstaForex lo mantendrá bien informado de las tendencias del mercado! Al ser un cliente de InstaForex, se le proporciona una gran cantidad de servicios gratuitos para una operación eficiente.

