 Permanecer
Condiciones de negociación
Products
Herramientas


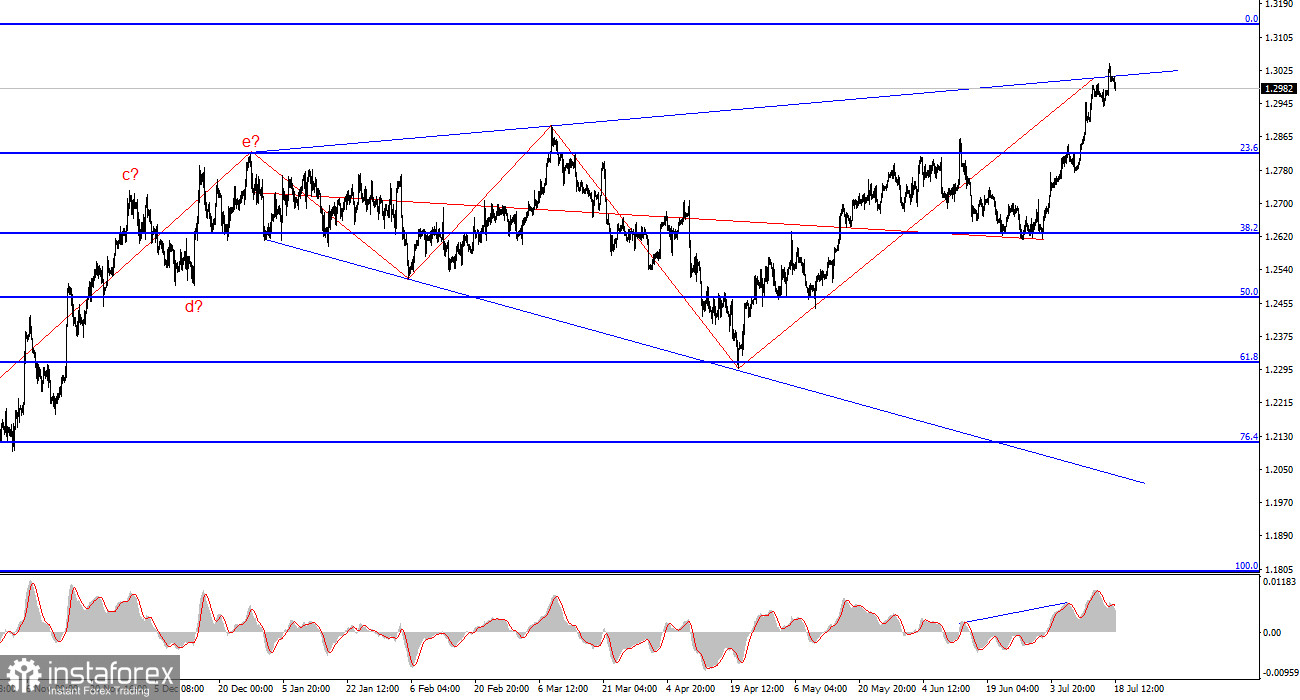
The wave pattern for the GBP/USD instrument remains quite complex and needs clarification. Around the mark of 1.2822, which corresponds to 23.6% on the Fibonacci scale, located near the peak of the supposed wave 2 or b, a downward wave began to form several weeks ago, but it did not last long. I assumed this was the long-awaited wave 3 or c, but the unsuccessful attempt to break through the mark of 1.2627, which corresponds to 38.2% on the Fibonacci scale, once again pushed the instrument back to the last year's highs.
Currently, the wave pattern has become completely unreadable. I use simple structures in my analysis, as complex ones have too many nuances and ambiguous points. At present, we see an upward wave that overlaps a downward wave, which overlaps the previous upward wave, which overlaps the previous downward wave. The only thing that can be assumed is an expanding triangle with the upper point around the 1.30 figure and the balancing line around the 1.26 figure. Currently, the upper line of the triangle has been reached, so a decline in the instrument can be expected.
The GBP/USD rate decreased by 30 basis points on Thursday. The amplitude of movements was again quite weak, but such movements are consistent today. There was a lot of news on Thursday, considering economic data from the UK is relatively rare. It became known today that the unemployment rate in May remained unchanged at 4.4%. The unemployed increased slightly more than the market expected – by 32 thousand. And the average wage level increased by 5.7%, as expected. Therefore, two out of three reports did not surprise market participants, resulting in virtually no reaction to this data.
Demand for the British currency has been growing for three months. The likelihood of a Fed rate cut "in the near future" has been steadily increasing during this time. Now it is time to understand whether the market has priced in the September monetary policy easing and whether it is time to turn attention to the Bank of England, which is also on the verge of easing its policy. Negative data from the US have also fueled the one-sided movement of the instrument in recent months, but the market is, firstly, cyclical and, secondly, fractal. In other words, even if all factors favor only one currency, it does not mean it will rise in price. The time has come to build at least a corrective downward wave. In the near future, we should rely on the fact that the upper line of the expanding triangle has been worked out. A confident decline in the instrument should begin.
Overall Conclusions.
The wave pattern of the GBP/USD instrument still suggests a decline, but it has already undergone certain changes. I want to take my time to conclude, as this could lead to mistakes. Understanding how much the market is willing to push the pound upwards is necessary. If a new upward segment of the trend began on April 22, it has already taken on a five-wave form. Consequently, we should now expect at least a three-wave correction. An unsuccessful attempt to break through the upper line of the triangle may indicate the market's readiness for a downward wave set. This is a good point for selling.
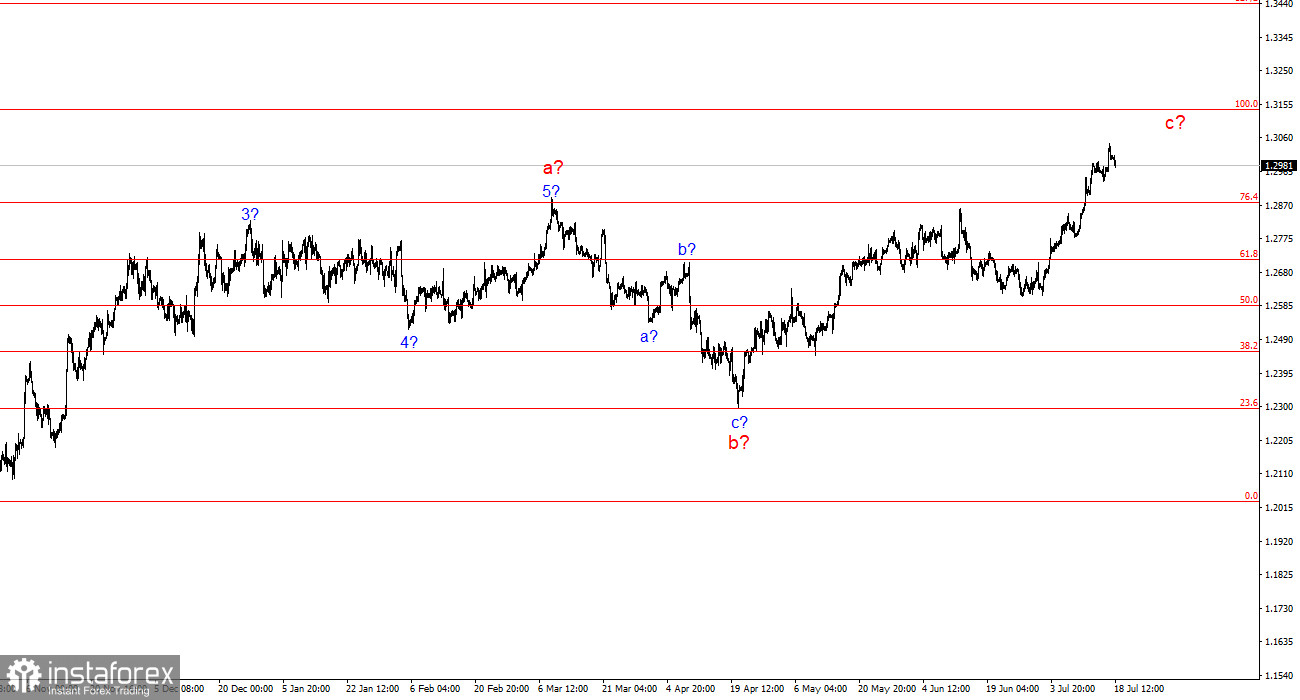
On a higher wave scale, the wave pattern is even more expressive. The downward corrective segment of the trend continues to form, and its second wave may be 100.0% of the first wave. The internal wave structure of this wave is completely unreadable.
The main principles of my analysis:
¡Los informes analíticos de InstaForex lo mantendrá bien informado de las tendencias del mercado! Al ser un cliente de InstaForex, se le proporciona una gran cantidad de servicios gratuitos para una operación eficiente.

