 Permanecer
Condiciones de negociación
Products
Herramientas


EUR/USD continued to pretend to trade on Friday. Volatility was again low, so we generally didn't see any movement throughout the day. Once again, novice traders could see that market activity (also known as volatility) is one of the most critical indicators. On Thursday, two important reports were published in the US – GDP and durable goods orders. And what happened? There were still no movements. On Friday, data on personal income and spending of the American population, the PCE index, and the consumer sentiment index were published in the US. What happened? There were still no movements. And we are already silent about the fact that the dollar had an excellent opportunity to appreciate on Thursday and Friday, as GDP grew much more substantial than expected, and the PCE index was higher than forecasts. A high GDP indicates that the Federal Reserve can continue to keep the rate at its peak value, and a high PCE suggests that inflation in the US may accelerate again.
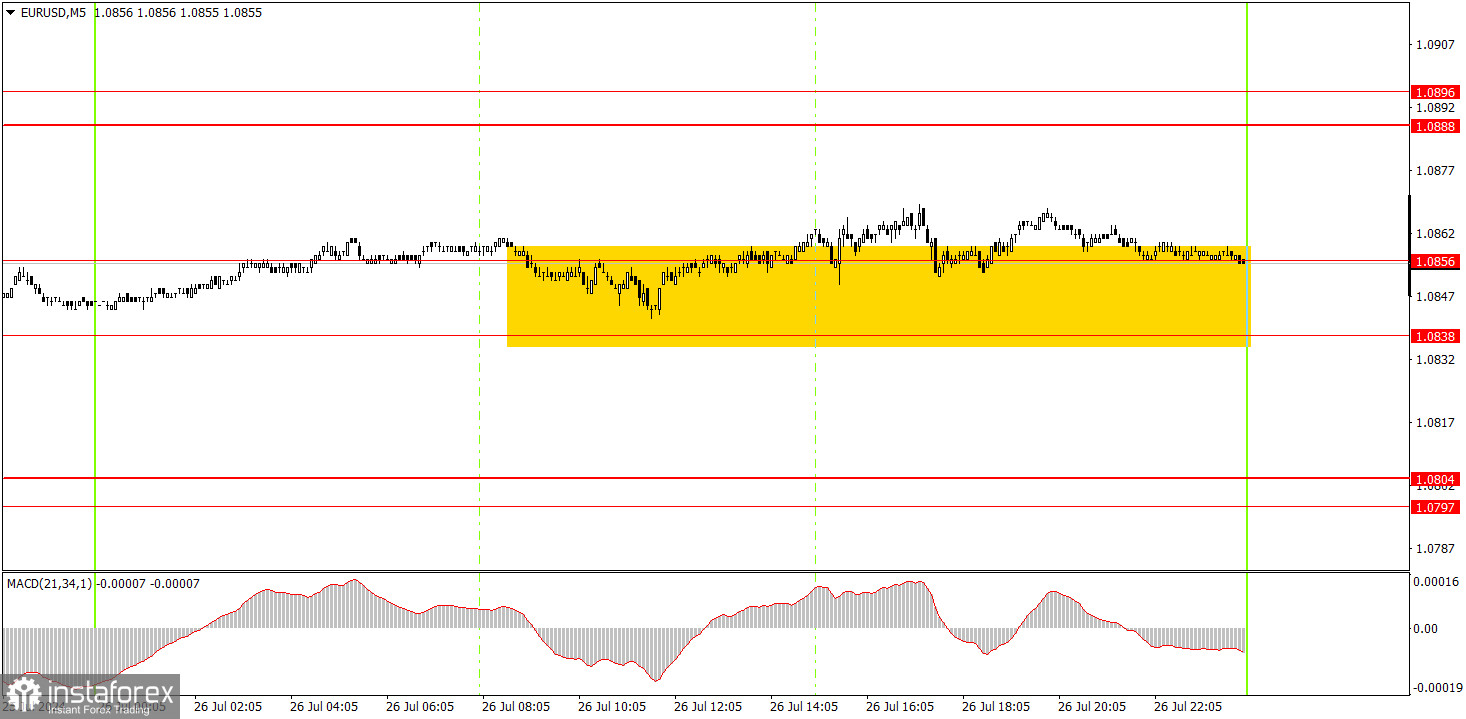
It doesn't make sense to highlight trading signals in the 5-minute timeframe for the second day. The price was around the 1.0838-1.0856 area almost all day, but can we say it broke through or bounced off it? We observed flat movement with low volatility. Even economic reports did not influence traders' desire to trade. Therefore, there was no sense in considering market signals.
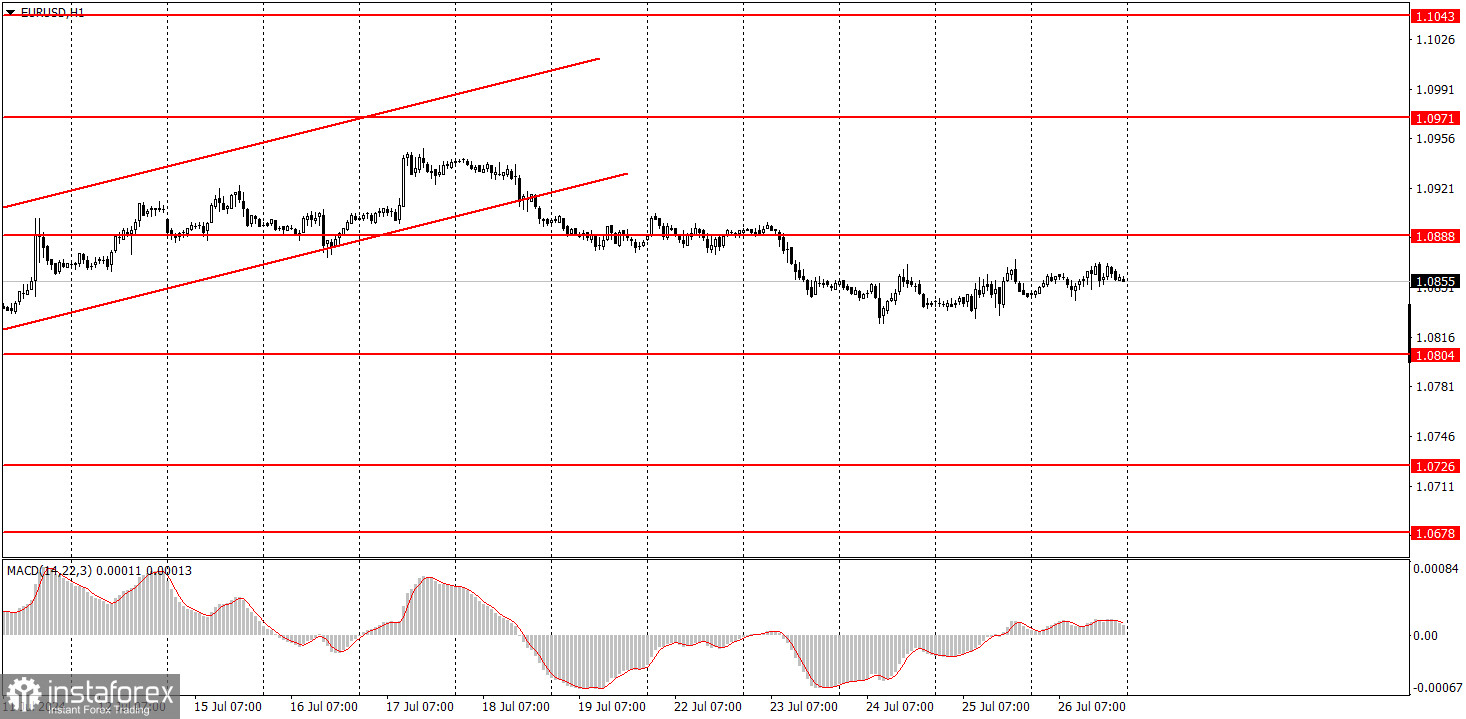
In the hourly time frame, EUR/USD settled below the ascending channel, allowing it to start a new local downward trend. We believe the euro has fully factored in all the bullish factors, so a significant correction is needed. However, the nature of the movements is best seen in the 24-hour timeframe. It is the same flat range between 1.0600 and 1.1000. Volatility remains low, and the market has generally stopped reacting to macro data and events.
On Monday, novice traders may try to trade from the 1.0838-1.0856 area again, but it is possible that the pair's movement will be similar to Thursday and Friday, making looking for entry points into the market pointless.
The key levels to consider on the 5M timeframe are 1.0526, 1.0568, 1.0611, 1.0678, 1.0726-1.0733, 1.0797-1.0804, 1.0838-1.0856, 1.0888-1.0896, 1.0940, and 1.0971-1.0981. No important events or reports are scheduled for Monday in the Eurozone or the US. The likelihood of witnessing low volatility again is very high.
1) The strength of a signal is determined by the time it took for the signal to form (bounce or level breakthrough). The shorter the time required, the stronger the signal.
2) If two or more trades around a certain level are initiated based on false signals, subsequent signals from that level should be ignored.
3) In a flat market, any currency pair can produce multiple false signals or none at all. In any case, it's better to stop trading at the first signs of a flat market.
4) Trades should be opened between the start of the European session and mid-way through the U.S. session. All trades must be closed manually after this period.
5) In the hourly time frame, trades based on MACD signals are only advisable amidst substantial volatility and an established trend, confirmed either by a trendline or trend channel.
6) If two levels are too close to each other (from 5 to 20 pips), they should be considered as a support or resistance zone.
7) After moving 15 pips in the intended direction, the Stop Loss should be set to break-even.
Support and Resistance price levels can serve as targets when buying or selling. You can place Take Profit levels near them.
Red lines represent channels or trend lines that depict the current trend and indicate the preferred trading direction.
The MACD (14,22,3) indicator, encompassing both the histogram and signal line, acts as an auxiliary tool and can also be used as a source of signals.
Important speeches and reports (always noted in the news calendar) can profoundly influence the price dynamics. Hence, trading during their release calls for heightened caution. It may be reasonable to exit the market to prevent abrupt price reversals against the prevailing trend.
Beginners should always remember that not every trade will yield profit. Establishing a clear strategy, coupled with effective money management, is key to long-term success in trading.
¡Los informes analíticos de InstaForex lo mantendrá bien informado de las tendencias del mercado! Al ser un cliente de InstaForex, se le proporciona una gran cantidad de servicios gratuitos para una operación eficiente.


