 Permanecer
Condiciones de negociación
Products
Herramientas


Analysis:
The EUR/USD pair continues a sideways flat movement. The unfinished section of this trend is upward, starting from mid-April. The price is between clusters of potential reversal levels of different scale charts. Over the past two weeks, the quotes have formed a counter-correction, which is still incomplete.
Forecast: In the upcoming weekly period, a continuation of the sideways price movement of the euro is expected within the range of the nearest zones. Initially, pressure on the lower support boundary is possible. By the end of the current five-day period, a change in direction and a resumption of the pair's price growth are possible.
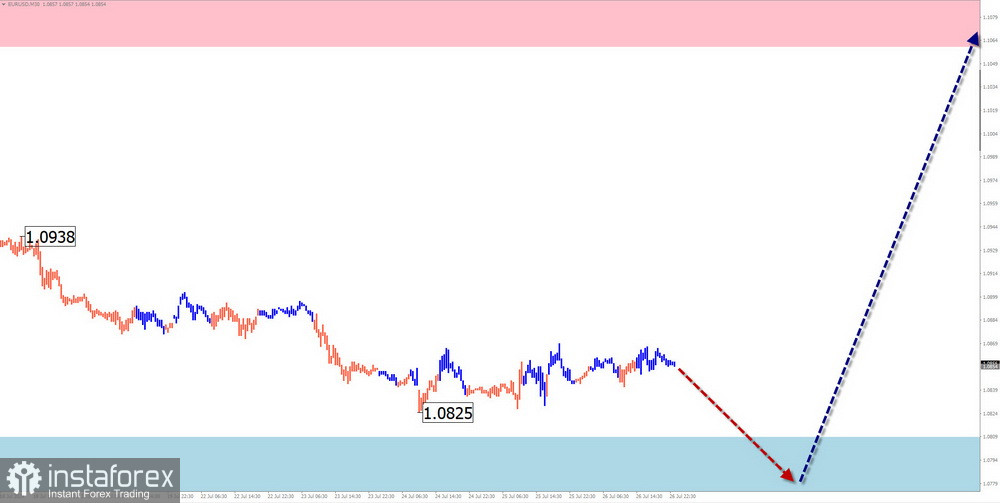
Potential Reversal Zones: Resistance:
1.1060/1.1110Support:
1.0810/1.0760
Recommendations:
Analysis: The USD/JPY pair has developed an upward trend since December last year. In the last unfinished section from May 3, the quotes have been forming a correction over the past two weeks in the form of an extended flat. The wave structure is nearing completion.
Forecast: In the coming days, the overall sideways movement of the pair is expected to continue. A downward vector with a decrease in support levels is possible. By the end of the week, the probability of a reversal and a resumption of the pair's price rise towards the resistance zone increases.
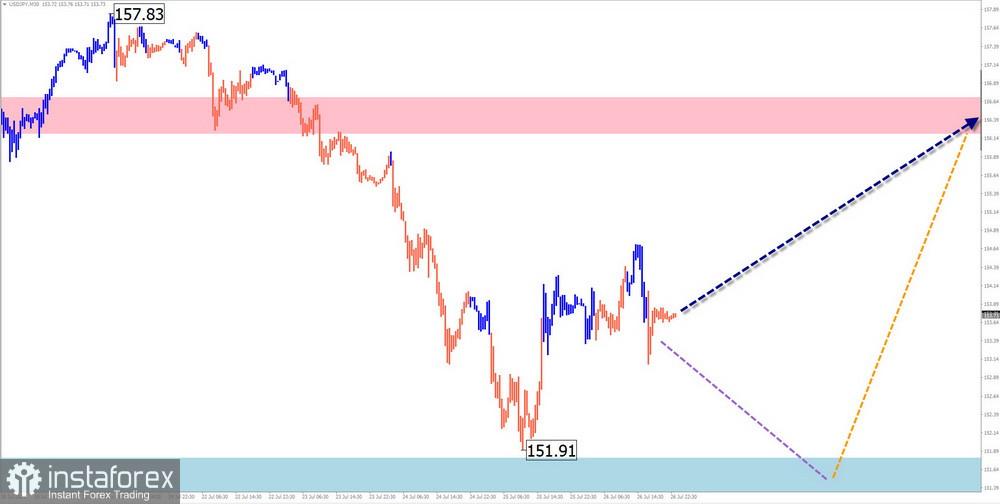
Potential Reversal Zones:
Resistance: 156.20/156.70Support: 151.80/151.30
Recommendations:
Analysis: The GBP/JPY pair has been in an upward wave, setting the trend since September of last year. Over the past month, the pair's price has been within the bounds of a strong potential weekly reversal zone. The last unfinished correction section has been ongoing since early June. The wave structure as a shifting plane is close to completion.
Forecast: By the end of the upcoming week, the sideways movement is expected to continue. A decline in support levels is not excluded. On Friday or early next week, the likelihood of a reversal and a resumption of the price rise increases.
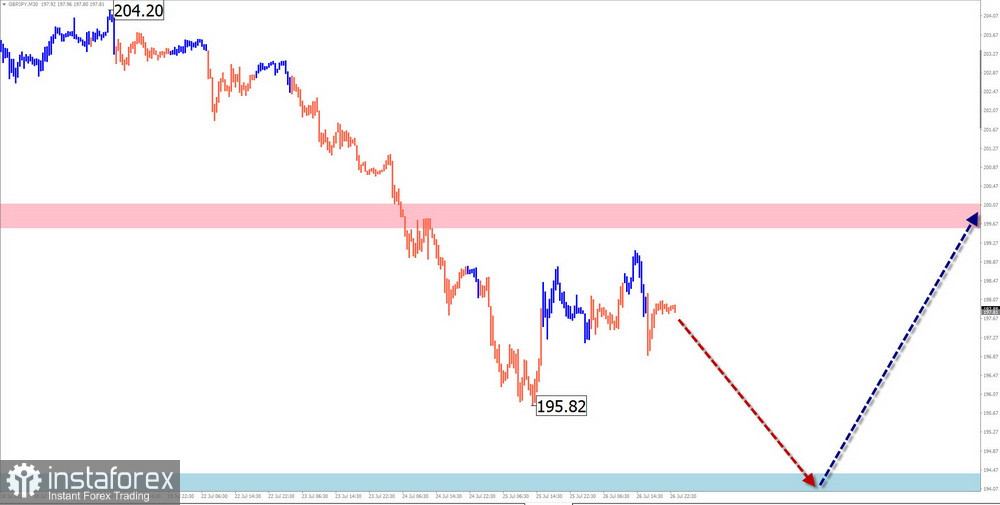
Potential Reversal Zones:
Resistance: 199.60/200.10Support: 194.40/193.90
Recommendations:
Analysis: The USD/CAD pair has had an unfinished upward wave since the end of last year. The pair's quotes have been drifting along the upper boundary of a wide potential reversal zone for over three months. The wave's extremes form an extended plane. The wave lacks the final part.
Forecast: The upward vector movement is expected to complete in the next couple of days. Then, in the resistance zone, a reversal can be expected. In the second half of the week, the likelihood of resuming the bearish course of the pair's price fluctuations increases.
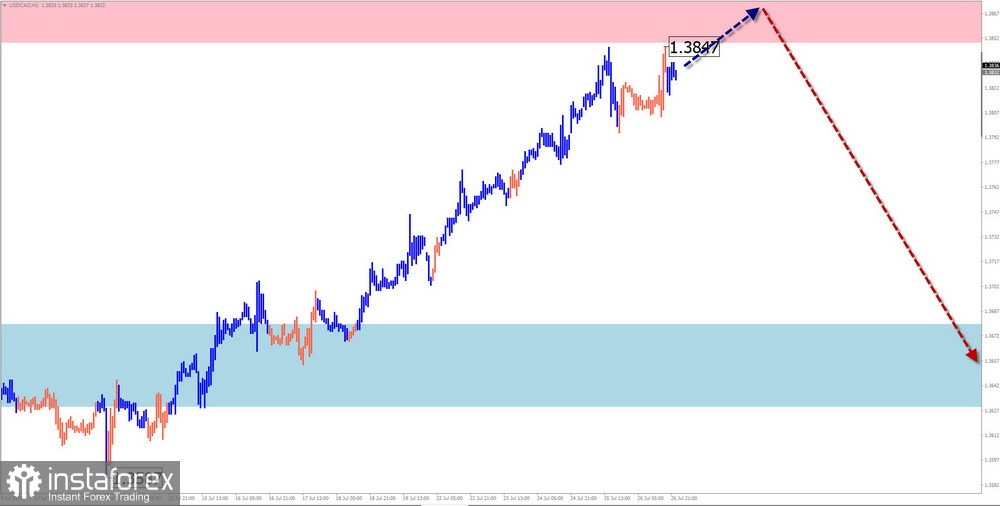
Potential Reversal Zones:
Resistance: 1.3850/1.3900Support: 1.3680/1.3630
Recommendations:
Brief Analysis: A descending wave determines the price fluctuations of the major pair of the New Zealand dollar since July last year. The price forms the middle part (B) as a horizontal plane throughout the current year. The last unfinished section of movement from June 12 is downward.
Weekly Forecast: At the beginning of the week, the decline will likely continue until the price contacts the support boundaries. A reversal and a resumption of price growth can be expected closer to the weekend. The expected weekly rise is limited by calculated resistance.
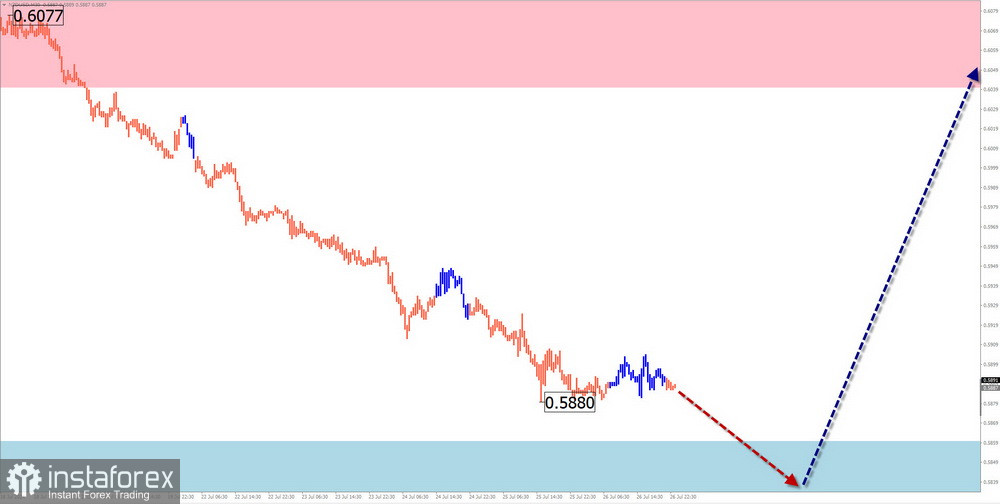
Potential Reversal Zones:
Resistance: 0.6040/0.6090Support: 0.5860/0.5810
Recommendations:
Analysis: In the short term, the direction of gold's movement is determined by a bullish wave from June 7. On a larger wave model, this section forms the middle part of the correction. Since July 17, the price has been moving downward in a price channel along the boundary of a strong potential reversal zone.
Forecast: By the end of the current week, an overall sideways movement in the gold price is expected. Brief declines are possible in the early days. A reversal can be expected in the support zone area. The start of price growth is more likely next week.
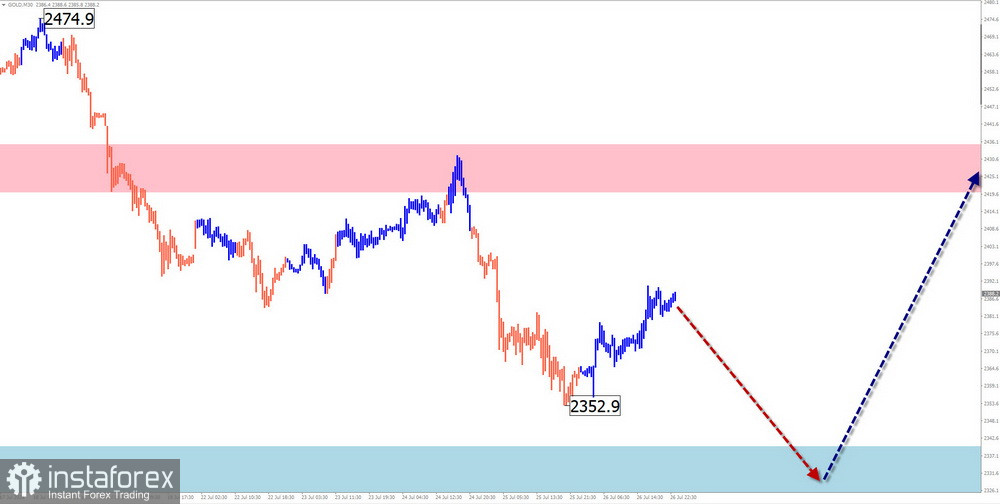
Potential Reversal Zones:
Resistance: 2420.0/2240.0Support: 2340.0/2320.0
Recommendations:
Explanation: In simplified wave analysis (SWA), all waves consist of 3 parts (A-B-C). The last unfinished wave is analyzed on each timeframe. Dashed lines show expected movements.
Attention: The wave algorithm does not consider the duration of instrument movements in time!
¡Los informes analíticos de InstaForex lo mantendrá bien informado de las tendencias del mercado! Al ser un cliente de InstaForex, se le proporciona una gran cantidad de servicios gratuitos para una operación eficiente.

