 Permanecer
Condiciones de negociación
Products
Herramientas


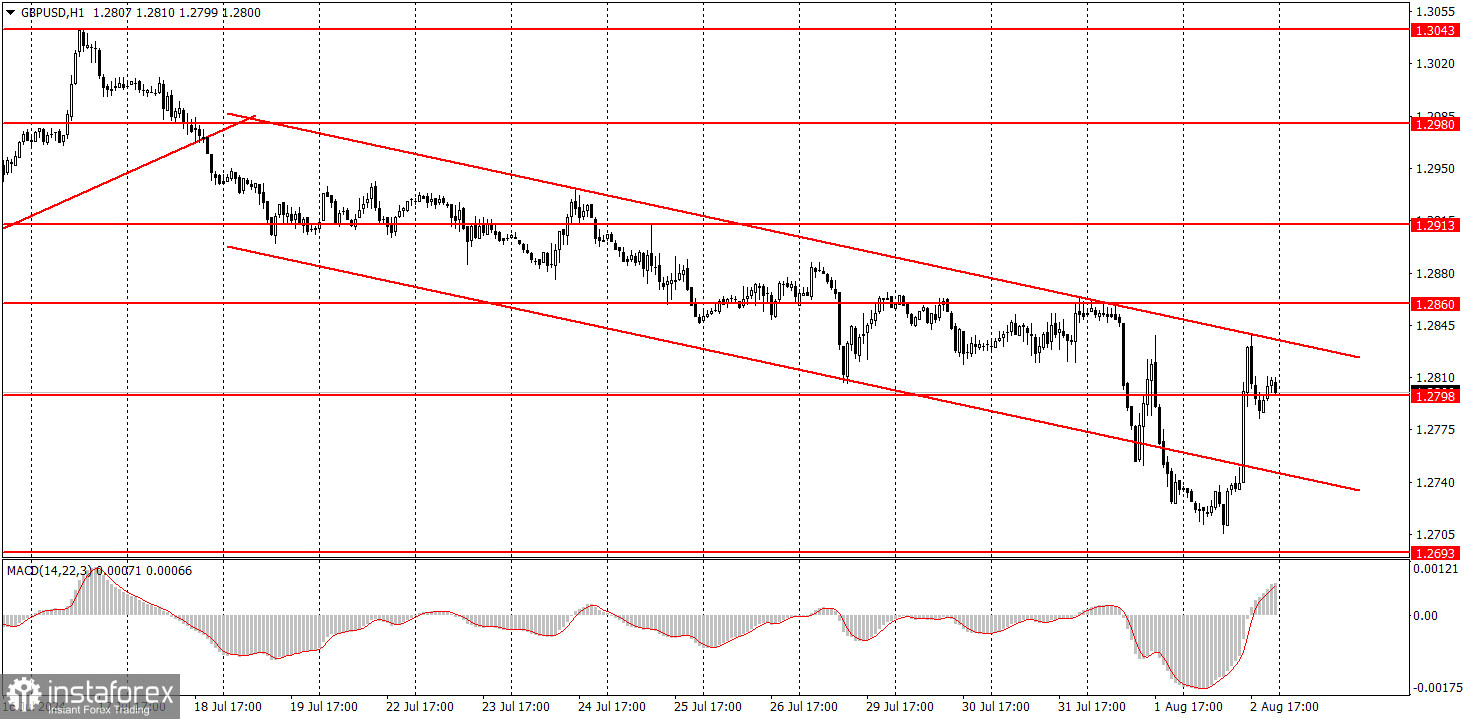
The GBP/USD pair also showed clear signs of strength on Friday, but it stayed within a descending channel due to a drop on Thursday. Thus, the downward trend remains intact, and the correction started on Friday. If we do not expect further growth for the euro, then even less so for the British pound. The Bank of England only began easing monetary policy. It is illogical to expect growth in a currency whose central bank is lowering rates. We are not asserting that the pound cannot start a new rise under any circumstances. We are just saying that such a move would not be logical. In any case, the price must consolidate above the descending channel to identify a new upward trend.
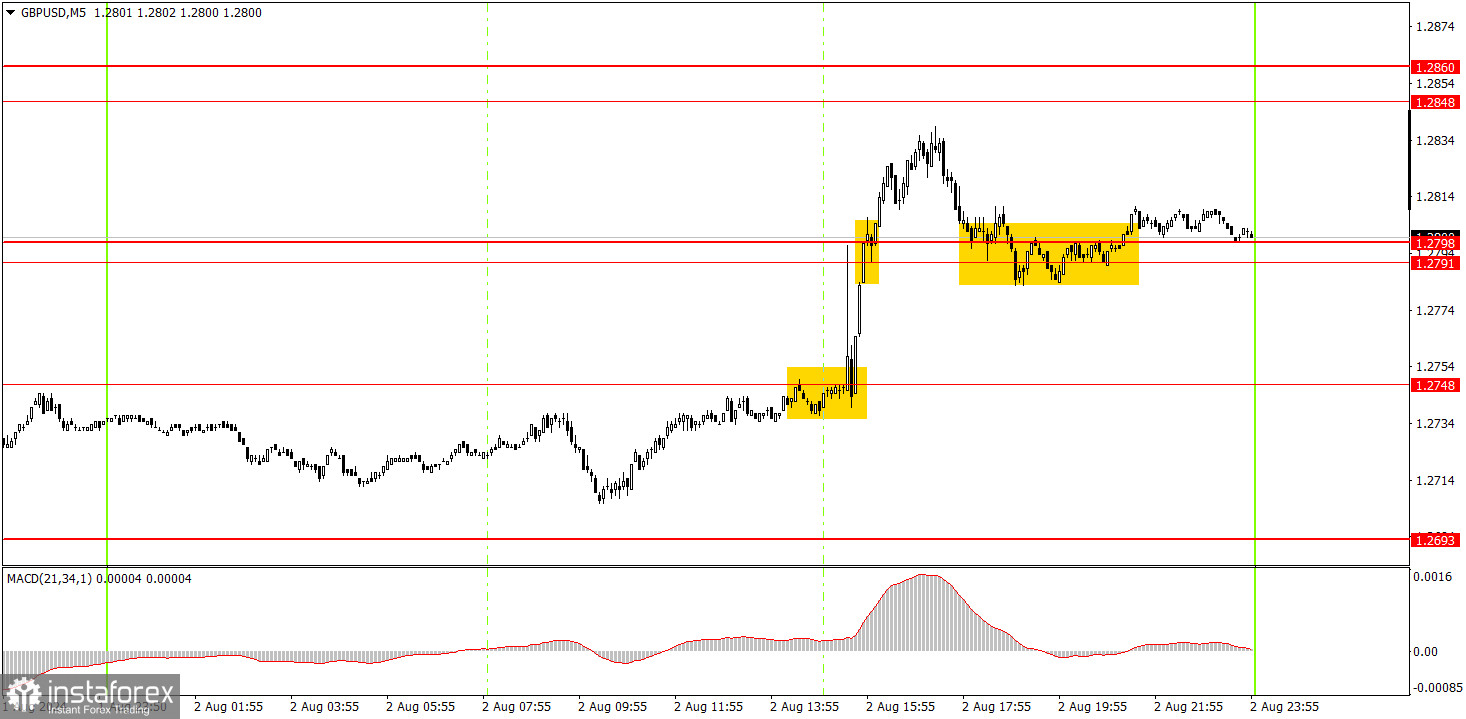
Several trading signals were formed in the 5-minute time frame on Friday but were very difficult to execute. The first buy signal was formed during the release of economic reports in the U.S. The price immediately soared from the level of 1.2748, making it physically very difficult to enter the market. Subsequently, the price stabilized above the area of 1.2791-1.2798, but by then, the price had moved more than 100 pips from the day's low. We believe entering the market on such a signal was not advisable. At the end of the day, the price tried to consolidate below the area of 1.2791-1.2798, but it was unsuccessful.
GBP/USD has a good chance of continuing its downward trend in the hourly time frame. The British pound is still overbought, the dollar is undervalued, and the BoE has started lowering its borrowing costs—what more is needed for the British currency to keep falling? The macro data once again spoiled the perfect picture for the dollar. However, at the same time, disappointing US reports will not come every day, and the UK also does not always provide good data. Yet, the fundamental background is no less important than the macroeconomic one.
On Monday, novice traders can trade from 1.2791-1.2798. A bounce from it could lead to new long positions targeting 1.2848. A consolidation below indicates a new drop.
The key levels to consider on the 5M timeframe are 1.2605-1.2633, 1.2684-1.2693, 1.2748, 1.2791-1.2798, 1.2848-1.2860, 1.2913, 1.2980-1.2993, 1.3043, 1.3102-1.3107, 1.3145. On Monday, July's final estimates of the Services PMI data will be published in the UK and the US. However, a more important ISM index for the service sector will also be published in the US.
1) The strength of a signal is determined by the time it took for the signal to form (bounce or level breakthrough). The shorter the time required, the stronger the signal.
2) If two or more trades around a certain level are initiated based on false signals, subsequent signals from that level should be ignored.
3) In a flat market, any currency pair can produce multiple false signals or none at all. In any case, it's better to stop trading at the first signs of a flat market.
4) Trades should be opened between the start of the European session and mid-way through the U.S. session. All trades must be closed manually after this period.
5) In the hourly time frame, trades based on MACD signals are only advisable amidst substantial volatility and an established trend, confirmed either by a trendline or trend channel.
6) If two levels are too close to each other (from 5 to 20 pips), they should be considered as a support or resistance zone.
7) After moving 15 pips in the intended direction, the Stop Loss should be set to break-even.
Support and Resistance price levels can serve as targets when buying or selling. You can place Take Profit levels near them.
Red lines represent channels or trend lines that depict the current trend and indicate the preferred trading direction.
The MACD (14,22,3) indicator, encompassing both the histogram and signal line, acts as an auxiliary tool and can also be used as a source of signals.
Important speeches and reports (always noted in the news calendar) can profoundly influence the price dynamics. Hence, trading during their release calls for heightened caution. It may be reasonable to exit the market to prevent abrupt price reversals against the prevailing trend.
Beginners should always remember that not every trade will yield profit. Establishing a clear strategy, coupled with effective money management, is key to long-term success in trading.
¡Los informes analíticos de InstaForex lo mantendrá bien informado de las tendencias del mercado! Al ser un cliente de InstaForex, se le proporciona una gran cantidad de servicios gratuitos para una operación eficiente.


