 Permanecer
Condiciones de negociación
Products
Herramientas


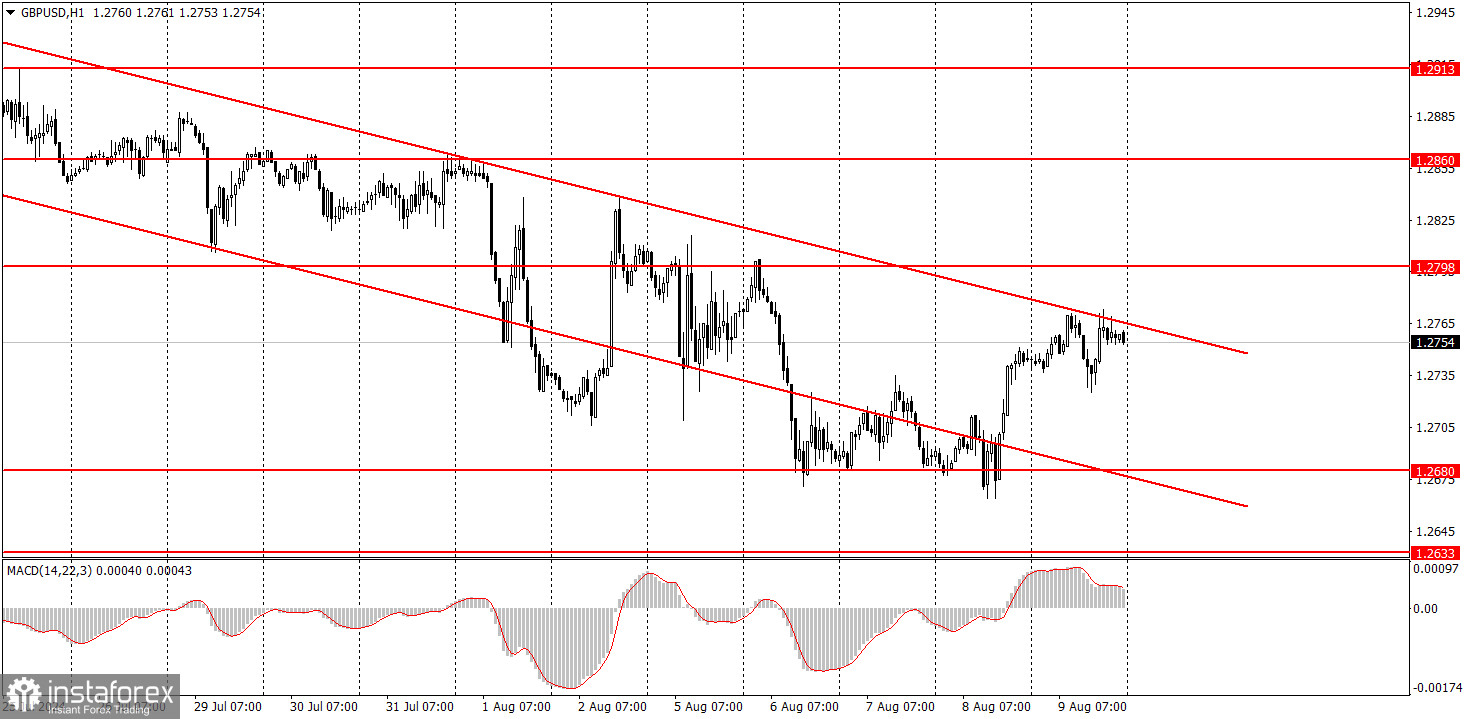
The GBP/USD pair also showed no desire for active movement on Friday. There were no macroeconomic or fundamental backgrounds that day, and after the rise on Thursday, the pair was near the upper line of the descending channel. Thus, the downward trend is still intact, and a rebound from the top of the channel could trigger a new round of decline for the British currency.
It's worth remembering that globally, the pound sterling should continue to decline as it has risen too strongly over the last 9-10 months, given the fundamental background. In most cases, it had no real reason to grow, but the market has been preemptively working on the Federal Reserve's rate cuts from the beginning of the year, which have yet to start. The market constantly invents new reasons to sell the US dollar, which have nothing to do with reality. Therefore, the growth of the British currency may resume, but it would require at least a consolidation above the channel.
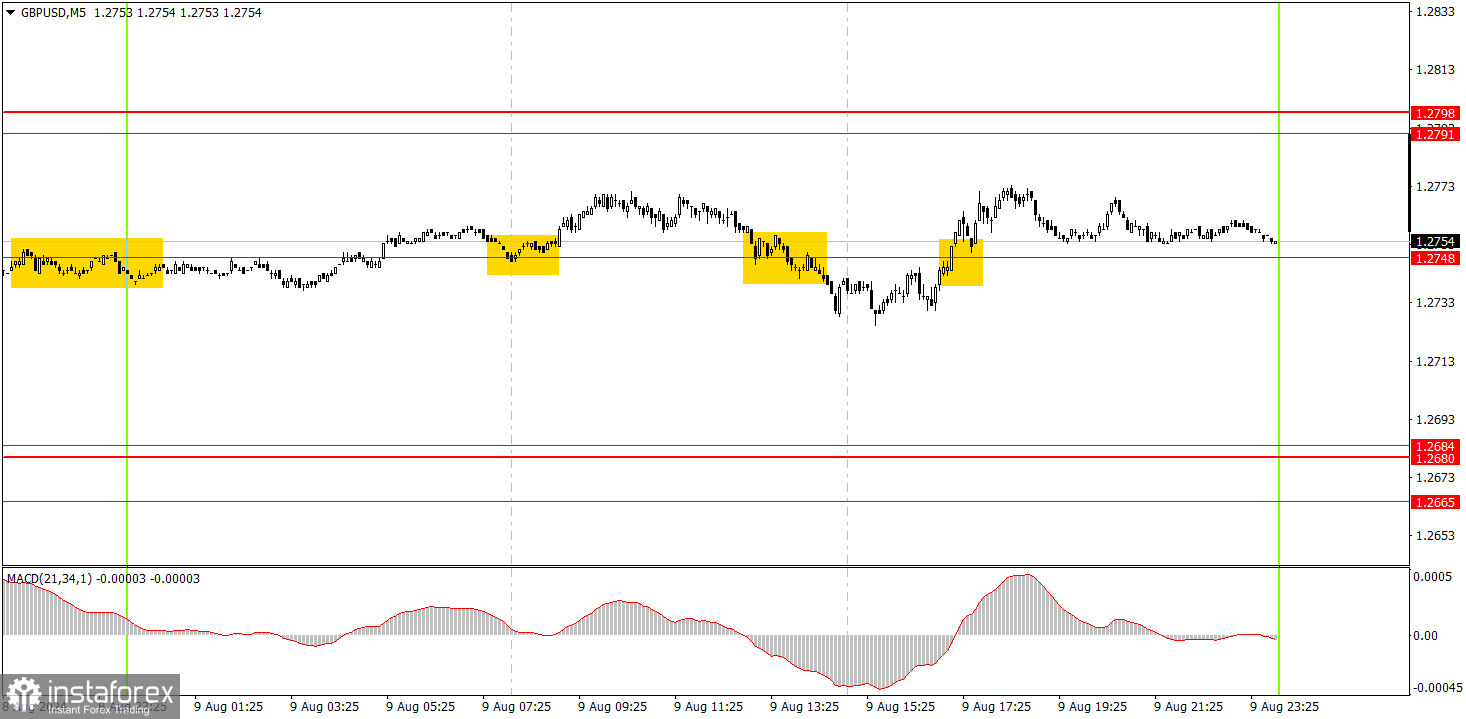
In the 5-minute time frame on Friday, three trading signals were formed near 1.2748. All three were false signals, as the pair showed a volatility of 50 pips and remained flat all day. After each signal, the price failed to move in the intended direction even by 20 pips. Once again, novice traders could see that signals will not bring profit without movements.
GBP/USD has a good chance of sustaining the downtrend, but it is currently going through a correction in the hourly time frame. The British pound is still overbought, while the dollar is undervalued. The Bank of England has started lowering its borrowing costs, which may continue to put pressure on the pound. The correction might be more substantial than it is now, which would inevitably lead to the price consolidating above the descending channel.
On Monday, beginners can trade from 1.2748. However, the fundamentals and macroeconomics will be absent on Monday, so there is a high probability of sustaining the flat phase.
The key levels to consider on the 5M timeframe are 1.2547, 1.2605-1.2633, 1.2684-1.2693, 1.2748, 1.2791-1.2798, 1.2848-1.2860, 1.2913, 1.2980-1.2993, 1.3043, 1.3102-1.3107, 1.3145. On Monday, no significant events are planned in the UK and the US, so volatility may remain low unless something important happens over the weekend. Recently, such significant events have been frequent.
1) The strength of a signal is determined by the time it took for the signal to form (bounce or level breakthrough). The shorter the time required, the stronger the signal.
2) If two or more trades around a certain level are initiated based on false signals, subsequent signals from that level should be ignored.
3) In a flat market, any currency pair can produce multiple false signals or none at all. In any case, it's better to stop trading at the first signs of a flat market.
4) Trades should be opened between the start of the European session and mid-way through the U.S. session. All trades must be closed manually after this period.
5) In the hourly time frame, trades based on MACD signals are only advisable amidst substantial volatility and an established trend, confirmed either by a trendline or trend channel.
6) If two levels are too close to each other (from 5 to 20 pips), they should be considered as a support or resistance zone.
7) After moving 15 pips in the intended direction, the Stop Loss should be set to break-even.
Support and Resistance price levels: targets when opening long or short positions. You can place Take Profit levels near them.
Red lines represent channels or trend lines that depict the current trend and indicate the preferred trading direction.
The MACD (14,22,3) indicator, encompassing both the histogram and signal line, acts as an auxiliary tool and can also be used as a source of signals.
Important speeches and reports (always noted in the news calendar) can profoundly influence the price dynamics. Hence, trading during their release calls for heightened caution. It may be reasonable to exit the market to prevent abrupt price reversals against the prevailing trend.
Beginners should always remember that not every trade will yield profit. Establishing a clear strategy, coupled with effective money management, is key to long-term success in trading.
¡Los informes analíticos de InstaForex lo mantendrá bien informado de las tendencias del mercado! Al ser un cliente de InstaForex, se le proporciona una gran cantidad de servicios gratuitos para una operación eficiente.

