 Permanecer
Condiciones de negociación
Products
Herramientas


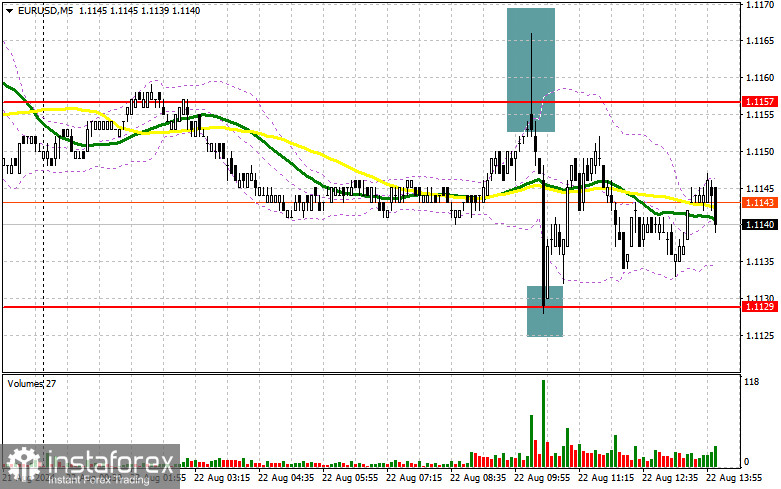
In my morning forecast, I highlighted the 1.1157 level and planned to make trading decisions based on it. Let's look at the 5-minute chart to see what happened. The rise and subsequent formation of a false breakout at the 1.1157 level provided an excellent opportunity to sell the euro, resulting in a profit of about 20 points. Active buying around the 1.1129 level provided a buying opportunity, keeping the trade within a sideways channel. The technical picture for the second half of the day has not changed.
To open long positions on EUR/USD:
The relatively weak manufacturing activity data in the Eurozone was balanced by stronger-than-expected performance in the services sector. While this tempered the pair's upward potential, it did not trigger a significant sell-off. In the second half of the day, various U.S. economic activity statistics will be released, including the manufacturing PMI, services PMI, and the U.S. composite PMI for August. Only very strong data indicating a recovery in manufacturing activity will be capable of triggering a more substantial correction in EUR/USD. Since the technical picture remains unchanged, I plan to stick to the morning strategy. Only a decline and the formation of a false breakout around the 1.1129 support level, similar to what was discussed earlier, would provide a good condition for opening long positions. This would aim for another euro rally and strengthen the bullish trend towards 1.1157. A breakout and consolidation above this range following weak U.S. statistics will lead to a further rise toward 1.1188. The ultimate target would be 1.1226, where I would lock in profits. If EUR/USD declines and there is no activity around 1.1129 in the second half of the day (this level has already been tested once), sellers will have a chance for a larger correction. In this case, I will consider entering long positions only after a false breakout forms around the next support level of 1.1102. I plan to open long positions on a rebound from 1.1073, targeting an upward correction of 30-35 points within the day.
To open short positions on EUR/USD:
Only very strong U.S. statistics will help the dollar regain its position ahead of Jerome Powell's speech tomorrow, but even this scenario may be questioned, as there are simply no real reasons to sell the euro following yesterday's FOMC minutes. If the euro attempts to rise, I expect sellers to act around the 1.1157 resistance level, which we couldn't break through in the first half of the day. The formation of a false breakout there, similar to what was discussed earlier, will be a reason to open short positions, targeting a decline toward the 1.1129 support level. A breakout and consolidation below this range, along with a retest from the bottom up, will provide another selling opportunity, targeting the 1.1102 area, where I expect more active buyer interest. The ultimate target would be the 1.1073 area, where I would lock in profits. If EUR/USD continues to rise in the second half of the day, extending the trend, and bears fail to show up at 1.1157 (which is more likely), buyers will have a chance for further significant growth. In this case, I will postpone selling until the next resistance at 1.1188 is tested. I will also sell from there but only after a failed consolidation. I plan to open short positions immediately on a rebound from 1.1226, targeting a downward correction of 30-35 points.
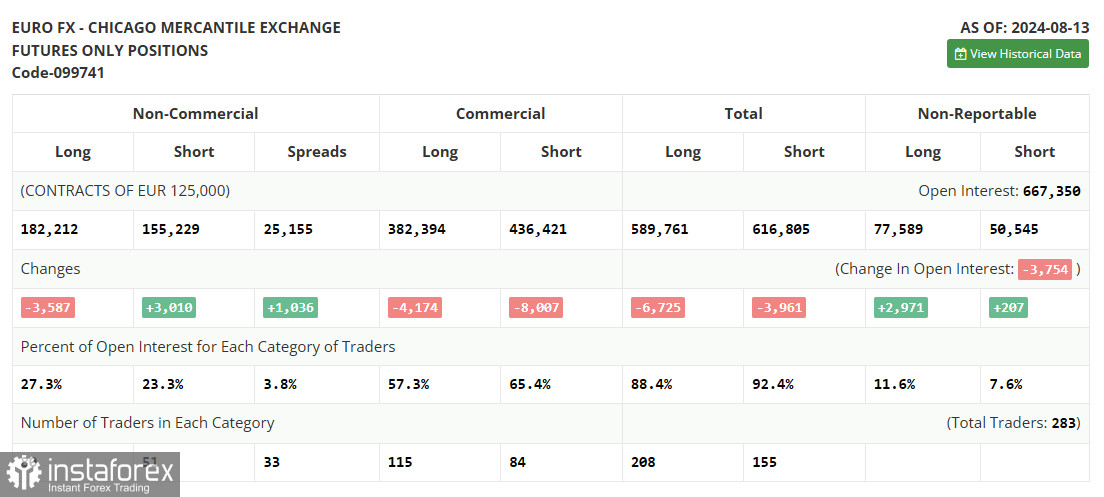
The COT report for August 13 showed an almost equal increase in short positions and a decrease in long positions, indicating a maintained market equilibrium following statements from several U.S. Federal Reserve representatives suggesting it's time to move toward monetary policy easing. The major event ahead in August is Jerome Powell's speech at Jackson Hole, where many investors and traders will try to understand the future course of monetary policy. Also, remember to keep a close eye on the economic calendar and incoming data. The COT report indicated that long non-commercial positions fell by 3,587 to 182,212, while short non-commercial positions increased by 3,010 to 155,229. As a result, the spread between long and short positions widened by 1,036.
Indicator Signals:
Moving Averages:
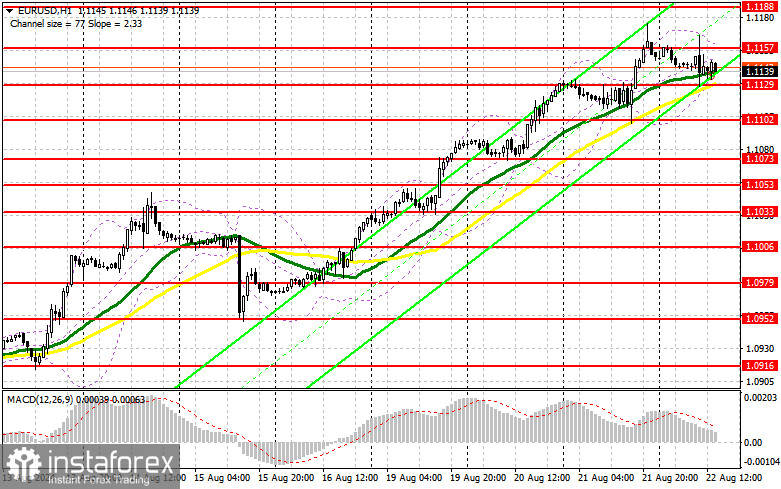
Trading is occurring around the 30 and 50-day moving averages, indicating a cautious stance among euro buyers.
Note: The period and prices of the moving averages are considered by the author on the H1 hourly chart and differ from the general definition of classical daily moving averages on the D1 daily chart.
Bollinger Bands:
In case of a decline, the lower boundary of the indicator at around 1.1129 will act as support.
Indicator Descriptions:
Total non-commercial net position: The difference between short and long positions of non-commercial traders.
¡Los informes analíticos de InstaForex lo mantendrá bien informado de las tendencias del mercado! Al ser un cliente de InstaForex, se le proporciona una gran cantidad de servicios gratuitos para una operación eficiente.

