 Permanecer
Condiciones de negociación
Products
Herramientas


El par de divisas EUR/USD se mantuvo en el mismo lugar durante toda la jornada del martes. El trasfondo macroeconómico fue bastante débil ayer, y no hubo ningún dato fundamental. De los datos macroeconómicos sólo podemos destacar el índice de confianza de los consumidores en Alemania, que cayó a -22 puntos, así como el informe del PIB para el segundo trimestre, que como era de esperar ascendió a -0,1% en términos trimestrales. Así pues, estos datos no pudieron apoyar al euro, pero tampoco ejercieron presión sobre él. Una vez más, los informes, débiles para el euro, no provocaron ninguna reacción en el mercado. De los acontecimientos fundamentales de hoy destacaron varias intervenciones de los representantes de la Fed, cada uno de los cuales dejó claro que las tasas de interés podrían reducirse en septiembre. Es decir, repitieron por completo la retórica de Jerome Powell. Es muy extraño que el dólar no cayera más a la baja con estas declaraciones.....
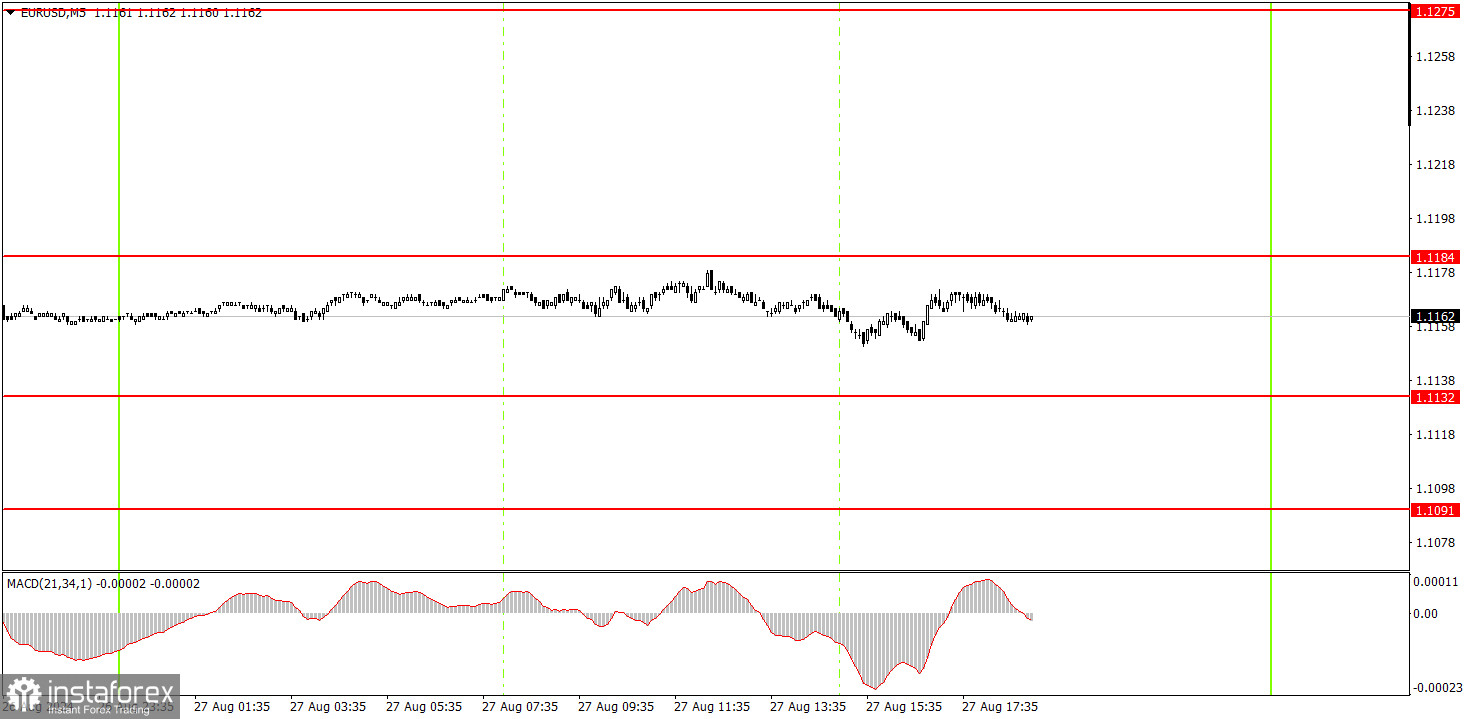
En el gráfico TF de 5 minutos, el martes se negoció todo el día con una volatilidad mínima y exclusivamente lateral. Por lo tanto, no se formó ni una sola señal de trading en todo el día.
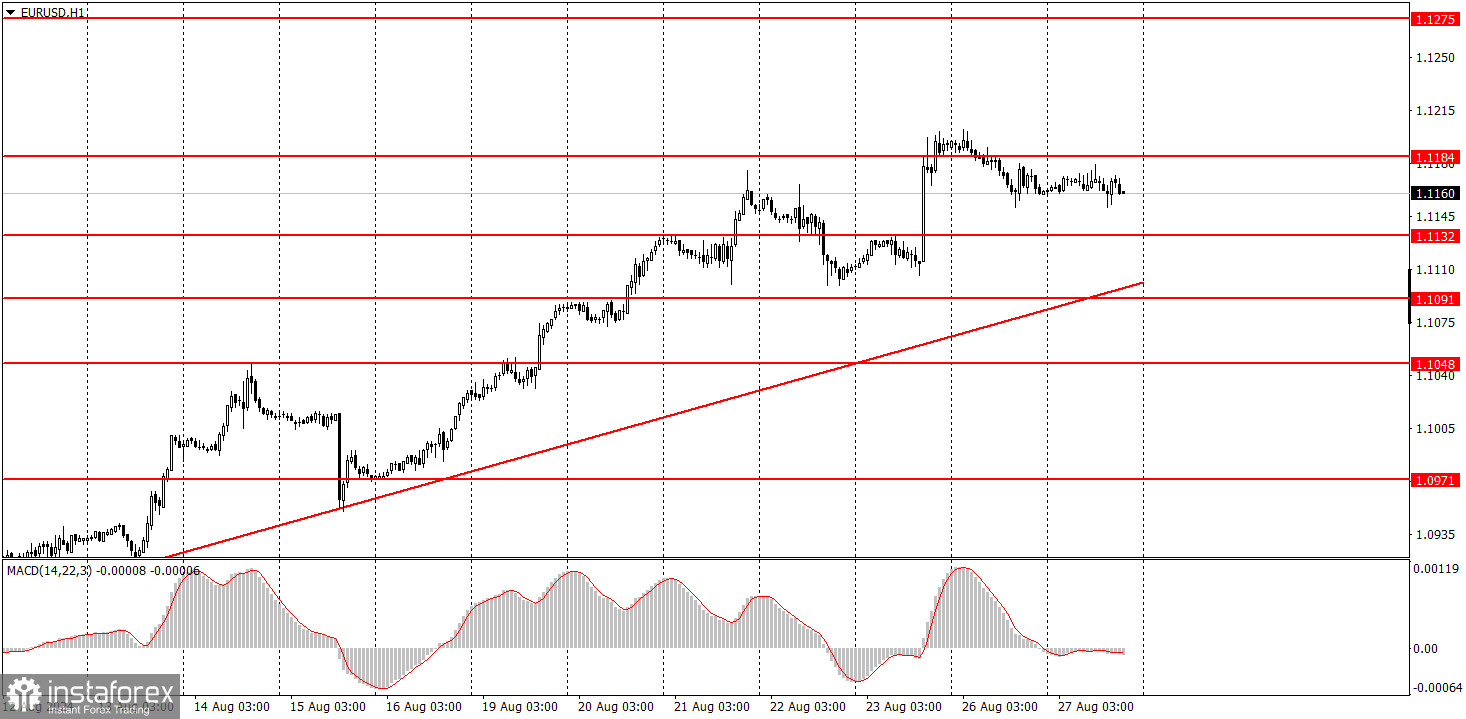
En el marco temporal de una hora, el par sigue formando una tendencia alcista, apoyada en la línea de tendencia. En nuestra opinión, la divisa europea ha agotado todos los factores de crecimiento previstos, por lo que no podemos esperar la continuación del movimiento alcista. Sin embargo, el mercado sigue mostrando que está listo para trabajar fuera de casi cualquier evento con ventas de pánico del dólar. Y si no hay acontecimientos, está dispuesto a vender el dólar a cambio de nada. Será posible esperar una caída tangible del par tras fijarse por debajo de la línea de tendencia.
El miércoles, los operadores novatos pueden esperar una caída, ya que el precio no puede subir eternamente. Sin embargo, debe entenderse claramente que tenemos una fuerte tendencia alcista. Mientras el precio esté por debajo del nivel de 1,1184 podemos esperar una ligera caída con el objetivo de 1,1132.
En el gráfico de 5 minutos deberíamos considerar los niveles 1,0726-1,0733, 1,0797-1,0804, 1,0838-1,0856, 1,0888-1,0896, 1,0940, 1,0971, 1,1011, 1,1048, 1,1091, 1,1132, 1,1184, 1,1275-1,1292. No hay eventos importantes o al menos de menor importancia programados para el miércoles en la Unión Europea y Estados Unidos. Por lo tanto, es posible que el euro siga bajando ligeramente o que veamos un flat.
1) La fuerza de la señal se considera por el tiempo que tardó en formarse (rebote o superación de un nivel). Cuanto menos tiempo tarde, más fuerte será la señal.
2) Si dos o más operaciones se abrieron cerca de cualquier nivel en señales falsas, todas las señales posteriores de este nivel deben ser ignoradas.
3) En flat, cualquier par puede formar muchas señales falsas o no formarlas en absoluto. Pero en cualquier caso, es mejor dejar de operar a las primeras señales de flat.
4) Las operaciones se abren en el período comprendido entre el inicio de la sesión europea y la mitad de la sesión americana, después de lo cual todas las operaciones deben cerrarse manualmente.
5) Dependiendo de las señales del indicador MACD, en el marco temporal de una hora conviene operar sólo si hay una buena volatilidad y una tendencia confirmada por una línea de tendencia o un canal de tendencia.
6) Si dos niveles están muy cerca el uno del otro (de 5 a 20 pips), deben ser considerados como soporte o resistencia.
7) Cuando se pasan 15 pips en la dirección correcta, se debe colocar un Stop Loss en el punto de equilibrio.
Los niveles de precios de soporte y resistencia son niveles que son objetivos para la apertura de compras o ventas. En torno a ellos se pueden colocar niveles de Take Profit.
Líneas rojas - canales o líneas de tendencia, que muestran la tendencia actual y en qué dirección es preferible operar ahora.
Indicador MACD(14,22,3) - histograma y línea de señal - un indicador auxiliar que también se puede utilizar como fuente de señales.
Los discursos e informes importantes (siempre incluidos en el calendario de noticias) pueden influir en gran medida en el movimiento de un par de divisas. Por lo tanto, durante su publicación debe operar con la mayor cautela posible o salir del mercado para evitar un brusco cambio del precio en contra del movimiento anterior.
Los principiantes que operan en el mercado de divisas deben recordar que todas las operaciones no pueden ser rentables. Desarrollar una estrategia clara y una gestión del capital es la clave del éxito en las operaciones a largo plazo.
¡Los informes analíticos de InstaForex lo mantendrá bien informado de las tendencias del mercado! Al ser un cliente de InstaForex, se le proporciona una gran cantidad de servicios gratuitos para una operación eficiente.

