 Permanecer
Condiciones de negociación
Products
Herramientas


The GBP/USD pair showed a downward movement on Monday, which could have been avoided. However, last week, the price overcame the ascending trend line, and the British pound remains extremely overbought. Therefore, considering all factors, the British currency should only fall—long and hard. Yet, the declines in the pair on Friday and Monday show at least some signs of the market's readiness to sell, not buy. And this has happened extremely rarely lately.
Several important reports will be published in the UK this week, but they are unlikely to impact the market sentiment dramatically. The only important report is US inflation, from which surprises can and should be expected. Recall that the market has reacted with massive dollar sell-offs several times if the actual inflation rate was even 0.1% below the forecast. It is clear that the Federal Reserve will begin monetary policy easing at the next meeting, but the market still allows for the possibility that this cut could be as much as 0.5%.
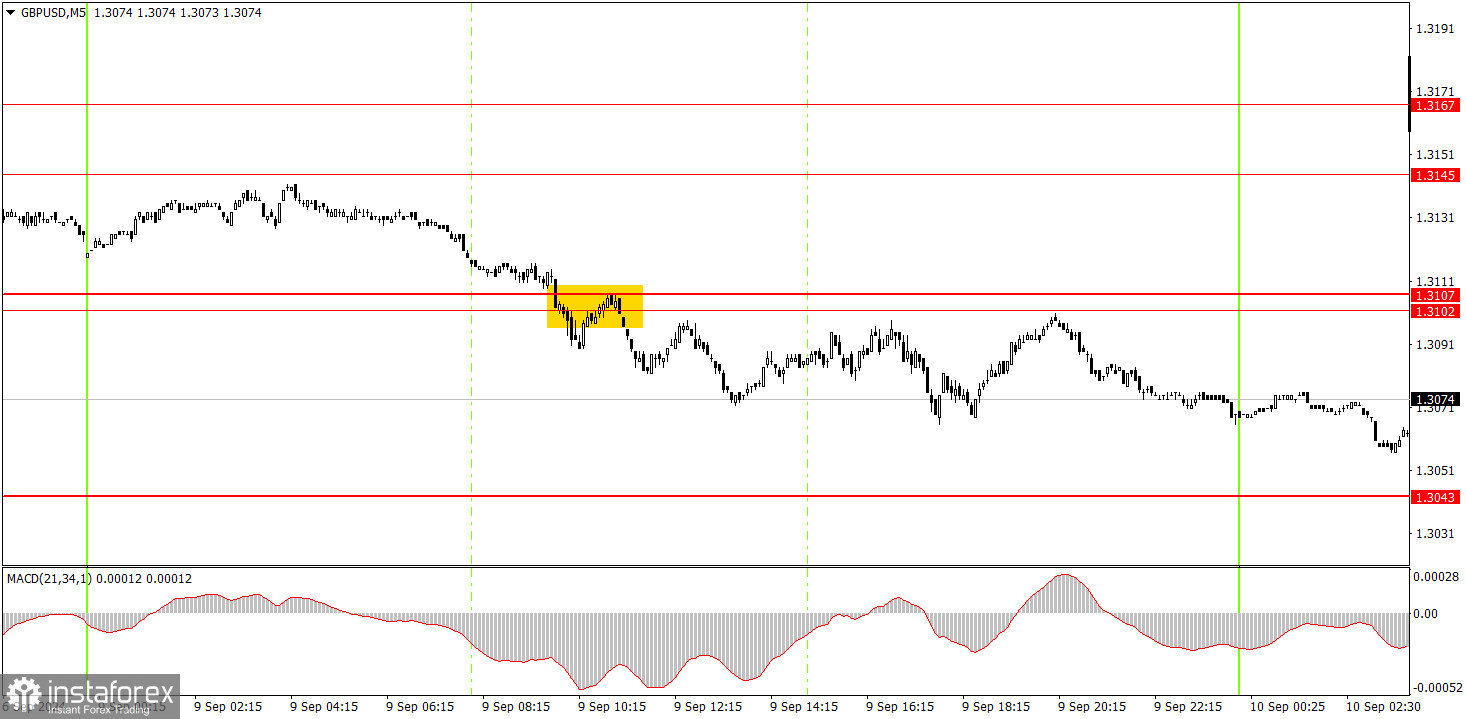
One trading signal was formed in the 5-minute time frame on Monday. During the European session, the price consolidated below the 1.3102-1.3107 area, after which it managed to move down by about 30-40 pips. It did not reach the nearest target level, but the downward movement may continue. Therefore, novice traders could open a short position yesterday, and it could be closed in the evening or wait for at least the 1.3043 level to be reached.
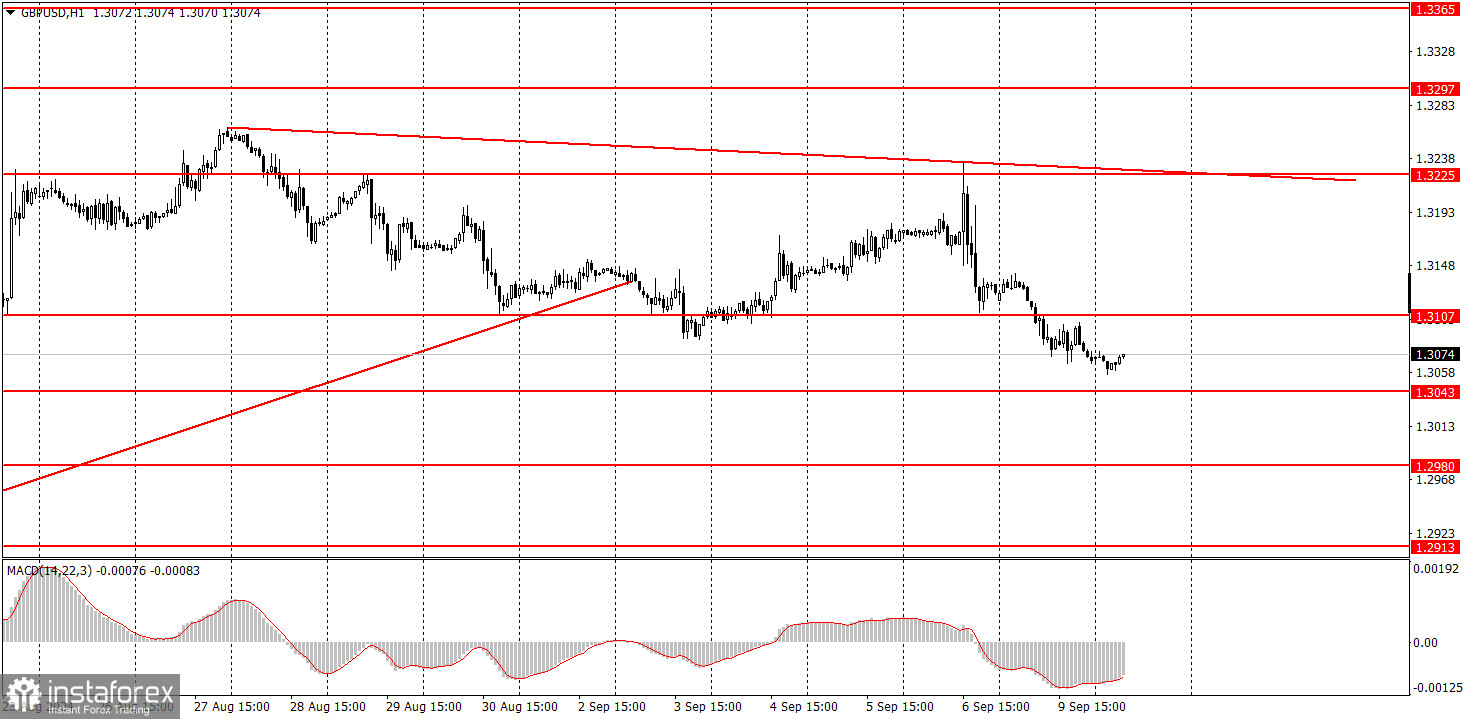
In the hourly time frame, GBP/USD has a good chance of resuming the global downward trend or at least experiencing some decline. The British pound remains overbought, the dollar is undervalued, and the market is still much more inclined to sell dollars than to buy them. So far, the pound only shows a minor bearish correction. It is too early to speak of a full-fledged downtrend.
On Tuesday, the pair might move in any direction, but we will likely see a flat movement. Last week, there were no new reasons for the dollar to rise, although the greenback remains excessively oversold.
The key levels to consider on the 5M timeframe are 1.2605-1.2633, 1.2684-1.2693, 1.2748, 1.2791-1.2798, 1.2848-1.2860, 1.2913, 1.2980-1.2993, 1.3043, 1.3102-1.3107, 1.3145-1.3167, 1.3225, 1.3272, and 1.3310. On Tuesday, reports on unemployment, wages, and changes in the number of unemployed will be released in the UK. These data may only provoke a local market reaction.
1) The strength of a signal is determined by the time it takes for the signal to form (bounce or level breakthrough). The less time it took, the stronger the signal.
2) If two or more trades were opened around any level due to false signals, subsequent signals from that level should be ignored.
3) In a flat market, any currency pair can form multiple false signals or none at all. In any case, it's better to stop trading at the first signs of a flat market.
4) Trades should be opened between the start of the European session and midway through the U.S. session. After this period, all trades must be closed manually.
5) In the hourly time frame, trades based on MACD signals are only advisable amidst good volatility and a trend confirmed by a trendline or trend channel.
6) If two levels are too close to each other (5 to 20 pips), they should be considered a support or resistance area.
7) After moving 20 pips in the intended direction, the Stop Loss should be set to break even.
Support and Resistance price levels: targets for opening long or short positions. You can place Take Profit levels around them.
Red lines: channels or trend lines that depict the current trend and indicate the preferred trading direction.
The MACD indicator (14,22,3): encompassing both the histogram and signal line, acts as an auxiliary tool and can also be used as a source of signals.
Important speeches and reports (always noted in the news calendar) can profoundly influence the movement of a currency pair. Hence, trading during their release calls for heightened caution. It may be reasonable to exit the market to avoid sharp price reversals against the prevailing movement.
For beginners, it's important to remember that not every trade will yield profit. Developing a clear strategy and effective money management is key to success in trading over the long term.
¡Los informes analíticos de InstaForex lo mantendrá bien informado de las tendencias del mercado! Al ser un cliente de InstaForex, se le proporciona una gran cantidad de servicios gratuitos para una operación eficiente.


