 Permanecer
Condiciones de negociación
Products
Herramientas


The USD/JPY pair fell just three pips short of the upper boundary of the target range of 139.70–140.27. However, since the level of 140.27 is taken from the weekly timeframe, it can be considered fulfilled. This level corresponds to the December 2023 low and the 61.8% corrective level, which has been fully worked out. The weekly time frame does not yet show signs of reversal, meaning that new targets lie ahead for the price: 136.90 (the lower boundary of the price channel), 135.45 (the 76.4% Fibonacci level), and 127.23 (the 100.0% Fibonacci level, which is the January 2023 low).
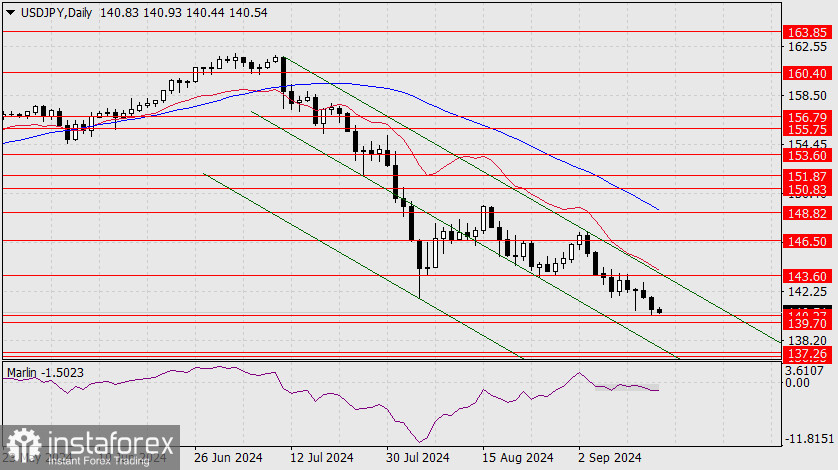
The daily chart also does not display reversal patterns. On the contrary, the Marlin oscillator is heading downward, aiming to exit the weekly consolidation. The movement's target is the embedded line of the descending price channel, in the area of 136.95–137.26 (the July 2023 low).
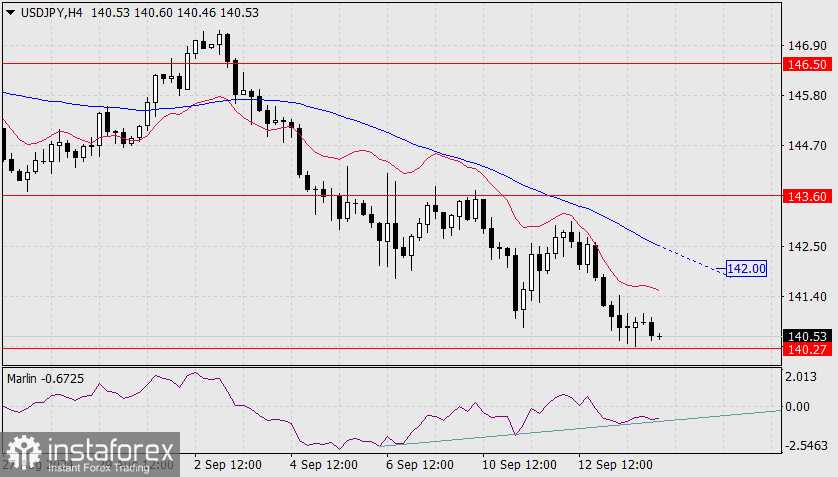
The four-hour chart has a reversal pattern—a double convergence. We noticed that the price was consolidating before breaking through the support levels of 153.60 and 146.50 on the daily chart. It's possible that the price will consolidate again before breaking below the current range. The first resistance to the correction is the MACD line around the 142.00 mark.
¡Los informes analíticos de InstaForex lo mantendrá bien informado de las tendencias del mercado! Al ser un cliente de InstaForex, se le proporciona una gran cantidad de servicios gratuitos para una operación eficiente.


