 Permanecer
Condiciones de negociación
Products
Herramientas


Trend-following analysis
This week, from the level of 1.3318 (close of the last weekly candle), the price may start moving down towards 1.3240 – the 14.6% retracement level (red dashed line). Upon reaching this line, the instrument is likely to begin moving up towards 1.3339 – the upper fractal (yellow dashed line).
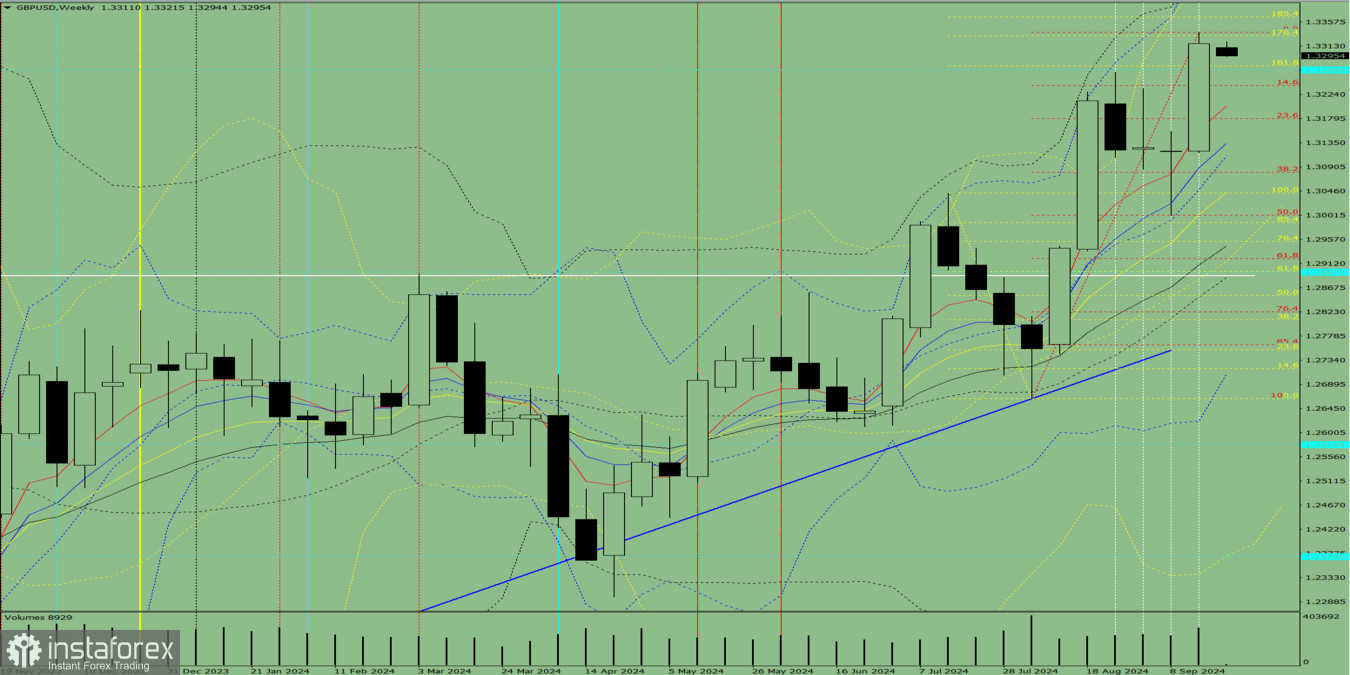
Figure 1 (weekly chart)
Complex analysis
Indicator analysis – down
Fibonacci levels – down
Trade volume – down
Candlestick analysis – down
Trend-following analysis – down
Bollinger Bands – up
Monthly chart – up
Conclusion from complex analysis: downward movement.
Overall summary of GBP/USD on weekly chart
This week, the price will likely follow a downtrend, due to the absence of the first upper shadow on the weekly black candle (Monday – down) and the presence of the second lower shadow (Friday – up).
This week, from the level of 1.3318 (close of the last weekly candle), the price may start moving down towards 1.3240 – the 14.6% retracement level (red dashed line). Once this level is reached, the instrument is likely to begin moving up towards 1.3339 – the upper fractal (yellow dashed line).
Alternative scenario. From the level of 1.3318 (close of the last weekly candle), the instrument may start moving down towards 1.3240 – the 14.6% retracement level (red dashed line). Upon reaching this line, the price will likely continue moving down towards 1.3179 – the 23.6% retracement level (red dashed line).
¡Los informes analíticos de InstaForex lo mantendrá bien informado de las tendencias del mercado! Al ser un cliente de InstaForex, se le proporciona una gran cantidad de servicios gratuitos para una operación eficiente.

