 Permanecer
Condiciones de negociación
Products
Herramientas


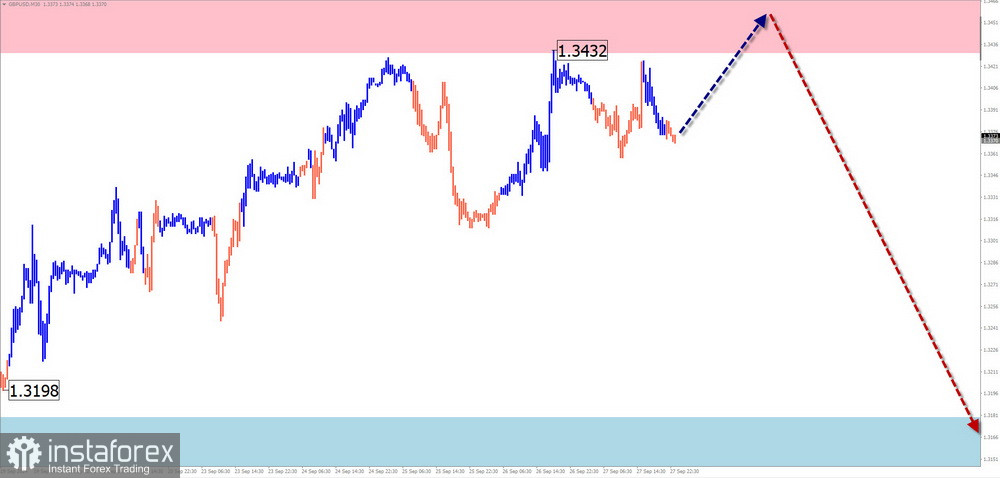
Brief Analysis:
In the last two months, the GBP/USD pair has been forming the final part (C) of the dominant upward trend that started in autumn last year. The price has approached the upper boundary of the potential reversal zone on the daily timeframe. The current wave structure does not yet show completion. For a breakthrough and continuation of the decline, the wave needs to gain momentum through a corrective move.
Weekly Forecast:
In the next few days, the British pound is expected to gradually move into a sideways trend. In the second half of the week, a reversal and the beginning of a price decline are likely. The support zone indicates the lower boundary of the expected weekly range.
Potential Reversal Levels
Recommendations:
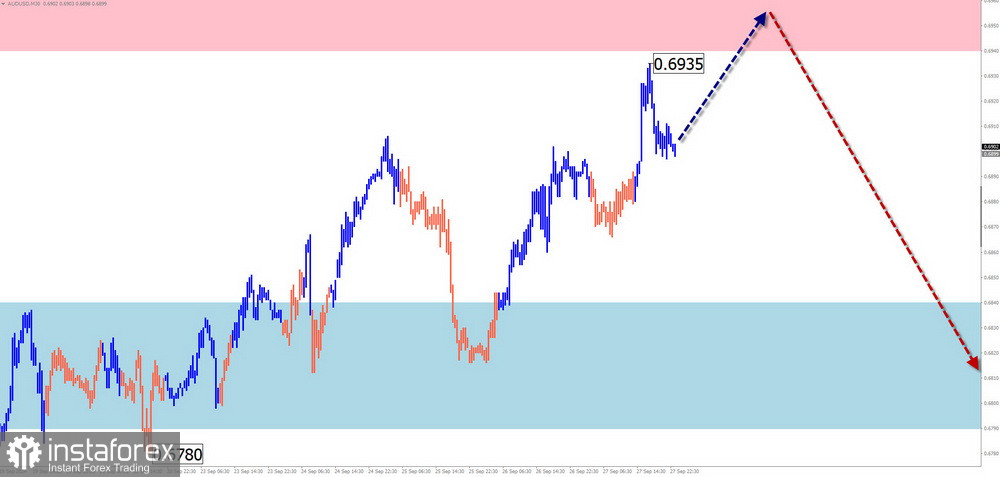
Brief Analysis:
The short-term trend direction of the Australian dollar has been set by an upward wave over the past two months. The ongoing segment of the main trend began on September 11. The price has reached the strong resistance levels on the daily chart, and the wave structure suggests conditions are ripe for an intermediate correction.
Weekly Forecast:
In the coming days, expect the upward movement to continue until the price reaches the resistance zone. By the end of the week, a reversal and a price decline are expected, potentially reaching the calculated support levels.
Potential Reversal Levels
Recommendations:
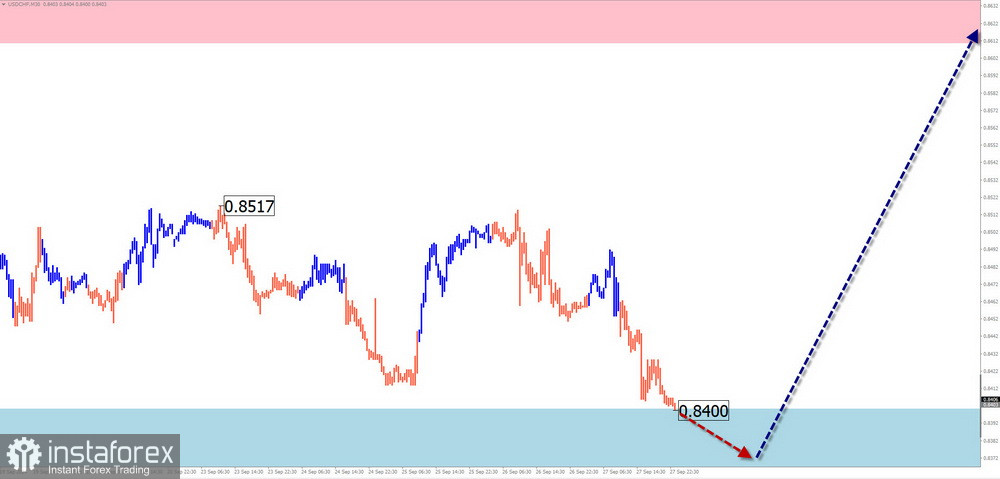
Brief Analysis:
The upward wave of the USD/CHF pair that began on August 5 has reversal potential and, if confirmed, will set a new short-term trend direction. The wave is developing sideways and needs to gain momentum through a correction before continuing.
Weekly Forecast:
At the start of the week, expect the price to continue moving sideways along the support zone. Closer to the weekend, renewed growth is expected, with the price likely rising no higher than the calculated resistance level.
Potential Reversal Levels
Recommendations:
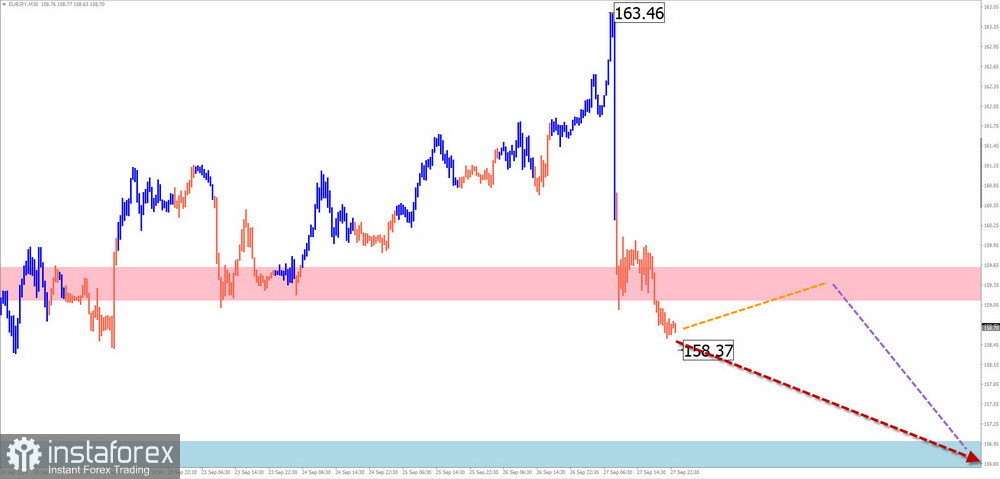
EUR/JPY
Brief Analysis:
The EUR/JPY pair has been trading within a strong potential reversal zone on the weekly timeframe for the last two months. The ongoing upward wave began on September 16. Last week, the corrective part of the movement (B) developed in a sideways pattern.
Weekly Forecast:
Expect sideways movement along the resistance levels in the coming days. In the second half of the week, volatility is likely to increase, followed by a reversal and a resumption of active price declines, possibly triggered by economic data releases.
Potential Reversal Zones
Recommendations:
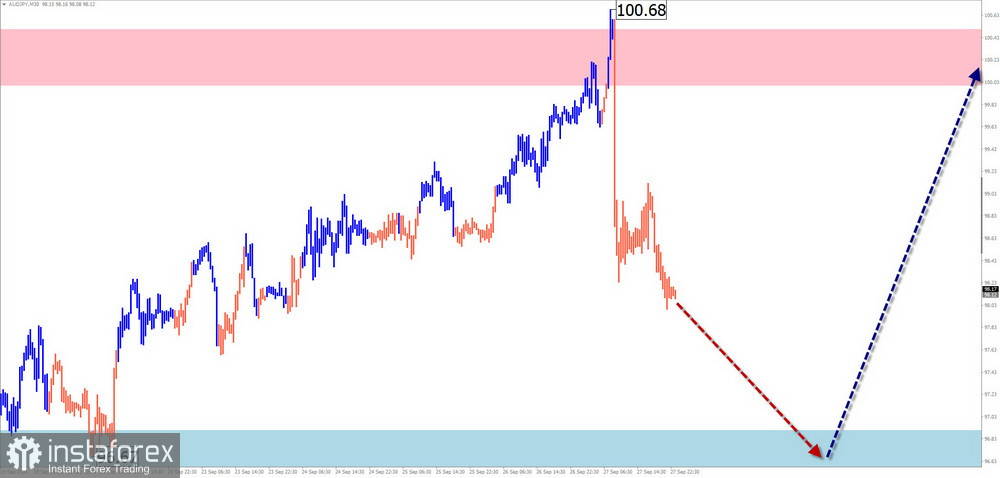
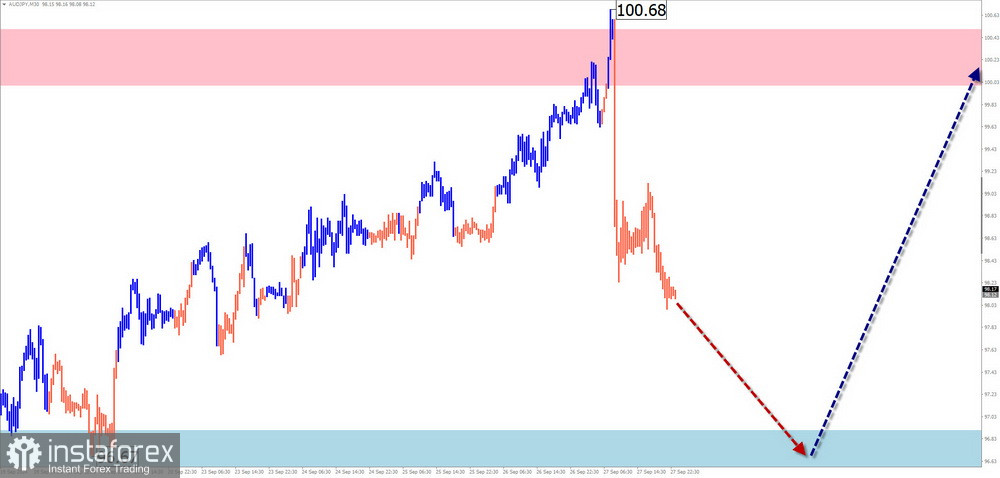
Overview:
Since the start of August, the AUD/JPY pair has been moving predominantly sideways. This section forms an upward plane on a larger chart scale, and the structure analysis indicates the formation of the middle part of wave (B).
Weekly Forecast:
At the start of the week, expect a downward vector, with the price reaching the calculated support boundaries. In this zone, reversal conditions may form, and a renewed rise in the pair's rate is likely by the end of the week.
Potential Reversal Zones
Recommendations:
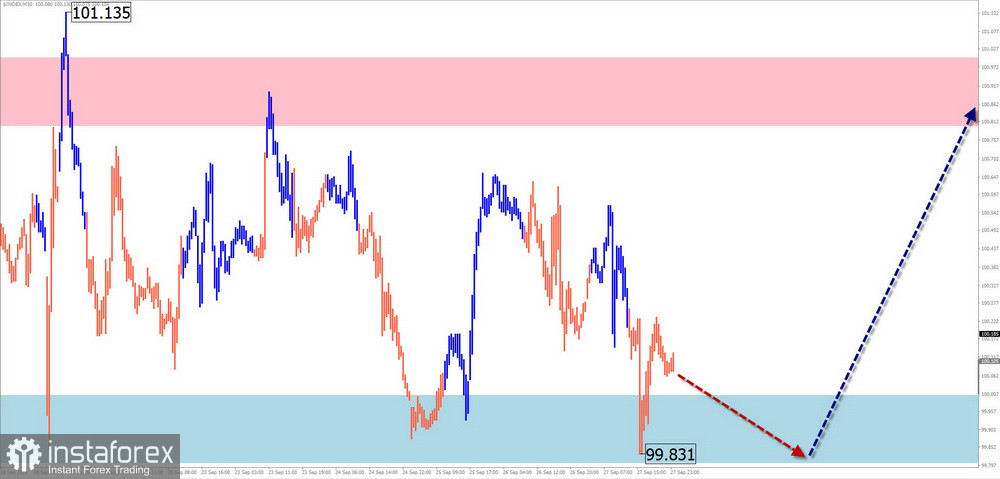
Overview:
The downward wave that started in mid-June set a new short-term trend direction for the USD Index. Two weeks ago, the price reached the upper boundary of a strong reversal zone on the weekly timeframe. There are currently no signals for an imminent reversal.
Weekly Forecast:
Expect the sideways movement to continue along the support zone at the start of the week, with possible pressure and a brief breach below its lower boundary. A resumption of upward movement is more likely toward the weekend.
Potential Reversal Zones
Recommendations:
Analysis:
On the Bitcoin chart, the trend direction is set by the algorithm of an upward wave from August 8 of this year. Over the past month, the price has been forming the final part of wave (C), which remains unfinished. The price is approaching strong resistance, and an intermediate correction is needed within the wave's final segment.
Weekly Forecast:
In the upcoming week, expect Bitcoin to continue rising until it reaches the resistance boundaries. In the following days, the likelihood of transitioning into sideways movement and beginning a price decline increases, with the support zone limiting the downward range.
Potential Reversal Zones
Recommendations:
Notes: In the simplified wave analysis (SWA), all waves consist of 3 parts (A-B-C). In each timeframe (TF), the last unfinished wave is analyzed. Dotted lines indicate expected movements.
Attention: The wave algorithm does not consider the duration of instrument movements over time!
¡Los informes analíticos de InstaForex lo mantendrá bien informado de las tendencias del mercado! Al ser un cliente de InstaForex, se le proporciona una gran cantidad de servicios gratuitos para una operación eficiente.

