 Permanecer
Condiciones de negociación
Products
Herramientas


El par GBP/USD continuó su lento movimiento bajista el miércoles. Pero al mismo tiempo, no se puede considerar lento en el sentido directo de la palabra, ya que el precio ha estado bajando durante casi 2 semanas casi sin parar y sin correcciones. Sí, esta semana el trasfondo fundamental no es interesante, y el trasfondo macroeconómico está realmente ausente. Por lo tanto, la volatilidad en el mercado ha disminuido bruscamente. Hoy puede subir tras la publicación del informe de inflación de EE.UU., e incluso podríamos ver una corrección. Sin embargo, todo el mundo está esperando la corrección ahora, por lo que los creadores de mercado pueden vender el precio aún más bajo cuando nadie lo espera. Y sólo después de eso puede comenzar la corrección. Básicamente, no hay nada más que decir sobre la libra esterlina. Sigue estando extremadamente sobrecomprada, por lo que a medio plazo sólo esperamos que caiga.
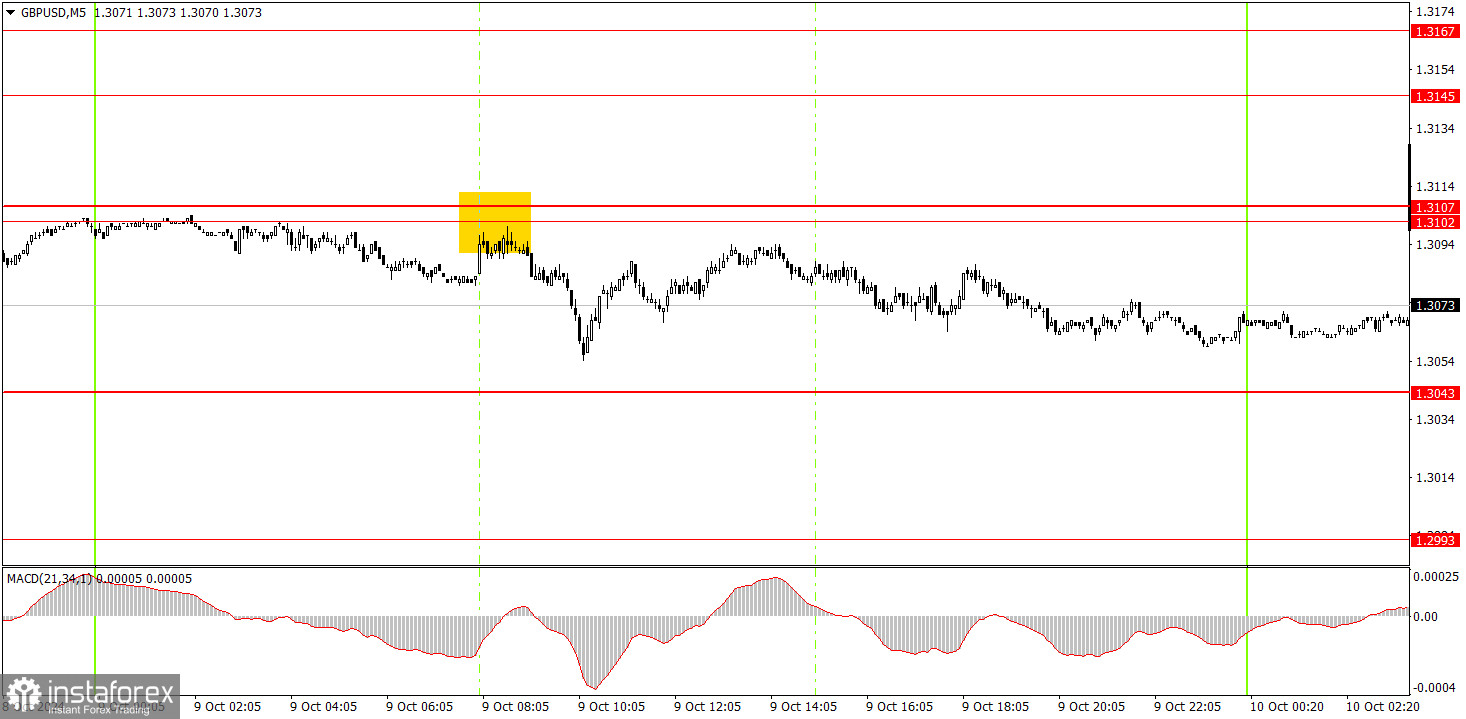
En el gráfico de 5 minutos del miércoles, se formó una señal de venta bastante buena cerca de la zona de 1,3102-1,3107. Después de su formación, el precio bajó inmediatamente unos 35 pips, luego se recuperó en el día y se consolidó hasta el final. El par no logró alcanzar el nivel objetivo de 1,3043. Hoy en la sesión americana hay posibles movimientos en diferentes direcciones.
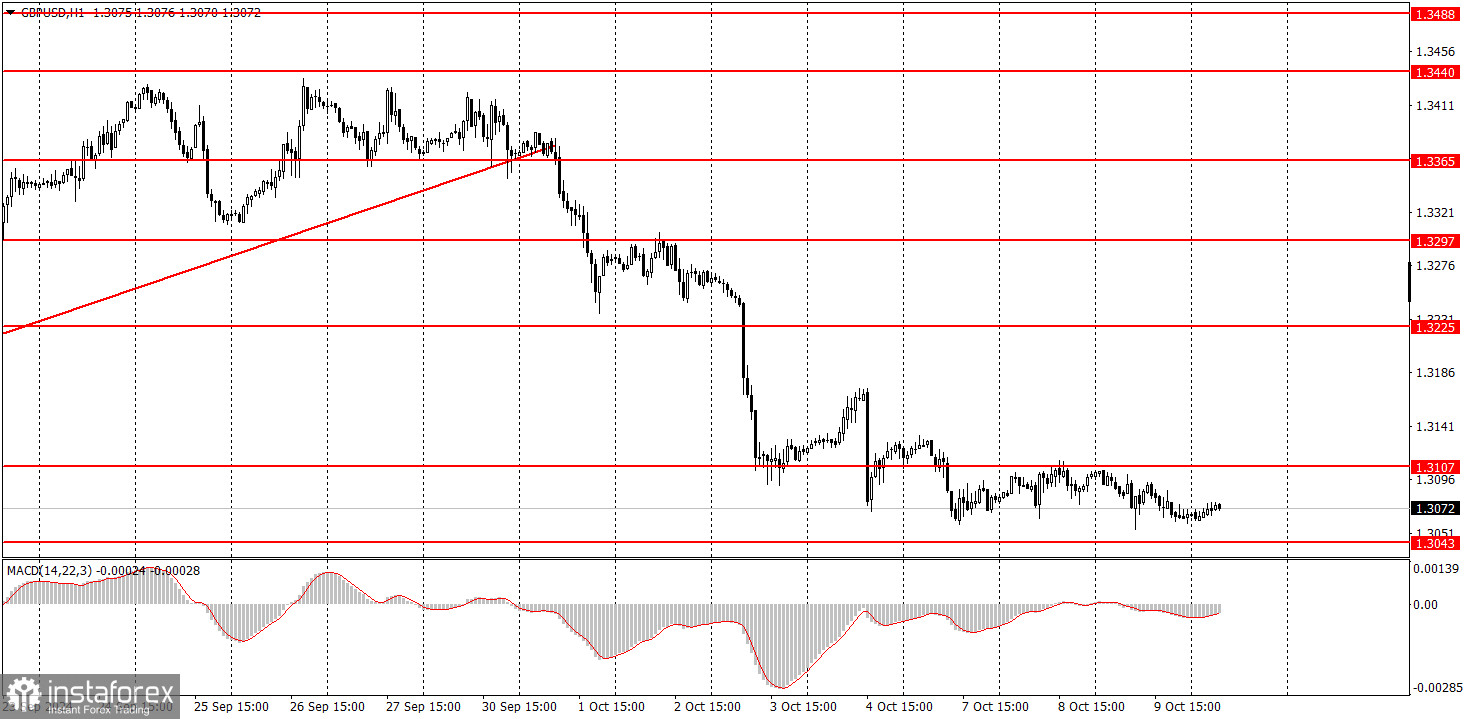
En el marco temporal de una hora, el par GBP/USD rompió la tendencia alcista. La moneda estadounidense ha comenzado su tan esperado crecimiento, pero debemos tener cuidado con las ventas, ya que el par ni siquiera ha intentado corregirse en las últimas dos semanas, y hoy es el informe de inflación de EE.UU.. Sin embargo, a medio plazo, apoyamos plenamente la caída del par, ya que creemos que es la única opción legítima.
El jueves, es posible que la libra esterlina continúe su lento descenso, ya que no logró consolidarse por encima de la zona de 1,3102-1,3107. Sin embargo, hoy es posible que el par caiga bruscamente en la sesión americana, seguido de una subida aún más fuerte, que será el inicio de la corrección.
En el gráfico de 5 minutos es posible operar en 1,2913, 1,2980-1,2993, 1,3043, 1,3102-1,3107, 1,3145-1,3167, 1,3225, 1,3272, 1,3365, 1,3428-1,3440, 1,3488, 1,3537. El jueves no hay eventos importantes programados en el Reino Unido, pero en Estados Unidos se publicará un informe sobre la inflación, que podría ser la base de movimientos en distintas direcciones durante un breve periodo de tiempo. Sea prudente.
1) La fuerza de la señal se considera por el tiempo que tardó en formarse (rebote o superación de un nivel). Cuanto menos tiempo tarde, más fuerte será la señal.
2) Si dos o más operaciones se abrieron cerca de cualquier nivel en señales falsas, todas las señales posteriores de este nivel deben ser ignoradas.
3) En flat, cualquier par puede formar muchas señales falsas o no formarlas en absoluto. Pero en cualquier caso, es mejor dejar de operar a las primeras señales de flat.
4) Las operaciones se abren en el período comprendido entre el inicio de la sesión europea y la mitad de la sesión americana, después de lo cual todas las operaciones deben cerrarse manualmente.
5) Dependiendo de las señales del indicador MACD, en el marco temporal de una hora conviene operar sólo si hay una buena volatilidad y una tendencia confirmada por una línea de tendencia o un canal de tendencia.
6) Si dos niveles están muy cerca el uno del otro (de 5 a 20 pips), deben ser considerados como soporte o resistencia.
7) Cuando se pasan 15 pips en la dirección correcta, se debe colocar un Stop Loss en el punto de equilibrio.
Los niveles de precios de soporte y resistencia son niveles que son objetivos para la apertura de compras o ventas. En torno a ellos se pueden colocar niveles de Take Profit.
Líneas rojas - canales o líneas de tendencia, que muestran la tendencia actual y en qué dirección es preferible operar ahora.
Indicador MACD(14,22,3) - histograma y línea de señal - un indicador auxiliar que también se puede utilizar como fuente de señales.
Los discursos e informes importantes (siempre incluidos en el calendario de noticias) pueden influir en gran medida en el movimiento de un par de divisas. Por lo tanto, durante su publicación debe operar con la mayor cautela posible o salir del mercado para evitar un brusco cambio del precio en contra del movimiento anterior.
Los principiantes que operan en el mercado de divisas deben recordar que todas las operaciones no pueden ser rentables. Desarrollar una estrategia clara y una gestión del capital es la clave del éxito en las operaciones a largo plazo.
¡Los informes analíticos de InstaForex lo mantendrá bien informado de las tendencias del mercado! Al ser un cliente de InstaForex, se le proporciona una gran cantidad de servicios gratuitos para una operación eficiente.


