 Permanecer
Condiciones de negociación
Products
Herramientas


El par de divisas EUR/USD continuó bajando el lunes. La caída continuó incluso el martes por la noche, aunque ayer no se publicaron informes ni en la UE ni en los EE.UU., y no hubo eventos importantes en estos países. Sin embargo, ahora la divisa europea sigue bajando simplemente todos los días. La caída es débil, la volatilidad es débil, pero el euro se mueve a la baja. Para nosotros no hay nada sorprendente en tal movimiento, ya que llevamos mucho tiempo señalando que el euro está sobrecomprado y excesivamente caro. Por lo tanto, el hecho de que ahora el euro esté cayendo casi todos los días es natural para nosotros. El mercado calculó de antemano todo el ciclo de flexibilización de la política monetaria por parte de la Reserva Federal, y cuando este ciclo comenzó, no quedaban motivos para vender el dólar. Además, el mercado ha olvidado por completo que el BCE también está bajando las tasas, y esta semana podría bajarlas por tercera vez. Por lo tanto, desde nuestro punto de vista, el par debería seguir cayendo a medio plazo.
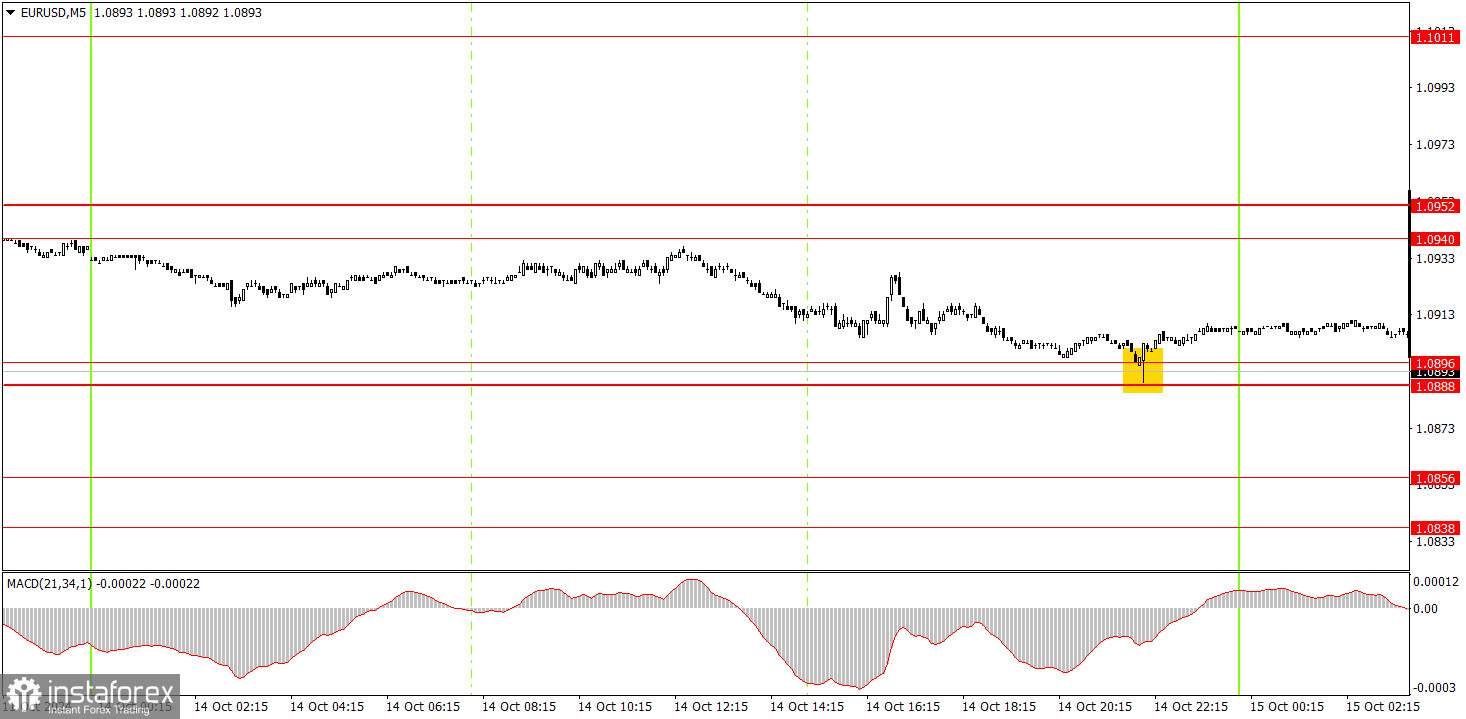
En el gráfico de 5 minutos, el lunes se formó una señal de compra a última hora de la tarde. El viernes el precio rebotó dos veces desde la zona de 1,0940-1,0951, el lunes no lo hizo, por lo que no hubo señales de venta. Y no nos interesan demasiado las señales de compra en la caída diaria del par. ¿Qué sentido tiene comprar cuando todo el mundo está vendiendo?
Análisis del par EUR/USD. El 15 de octubre. Cómo está cambiando el ánimo del mercado.
Recomendaciones para operar y análisis de las operaciones con el par EUR/USD para el 15 de octubre.
Recomendaciones ara operar y análisis de las operaciones con el par GBP/USD para el 15 de octubre.
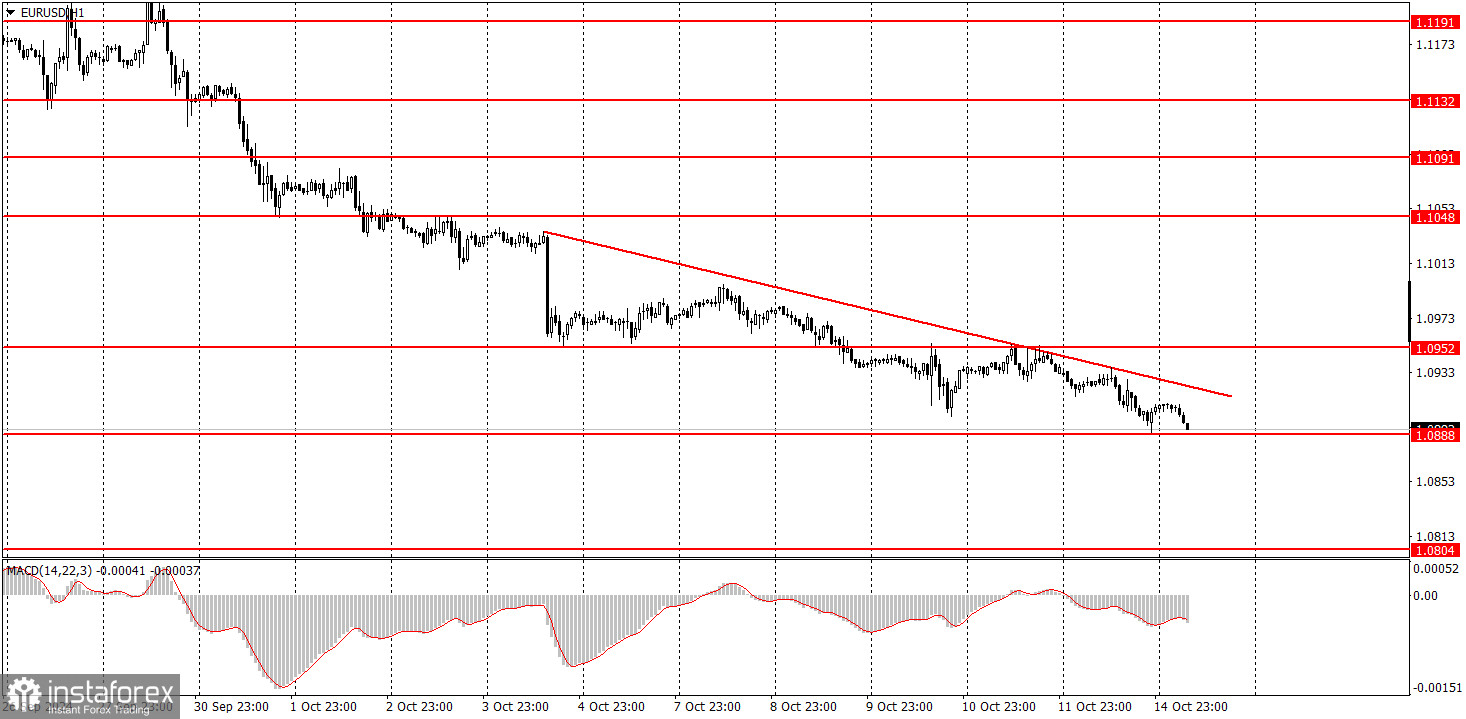
En el marco temporal de una hora, el par EUR/USD realizó un gran movimiento hacia una nueva tendencia bajista. Desafortunadamente, la venta ilógica del dólar aún podría reanudarse en el mediano plazo, ya que nadie sabe cuánto tiempo más el mercado va a resolver la flexibilización monetaria de la Fed. Pero en este momento, todavía hay una tendencia bajista en el gráfico de una hora. Es posible esperar una nueva caída del euro incluso sin una corrección, ya que sigue estando extremadamente sobrecomprado, pero sería más bonito con una corrección.
El martes podemos operar desde la zona de 1,0888-1,0896. Los movimientos volverán a ser (muy probablemente) débiles, por lo que no debemos esperar grandes beneficios.
En el gráfico de 5 minutos deberíamos considerar los niveles 1,0726-1,0733, 1,0797-1,0804, 1,0838-1,0856, 1,0888-1,0896, 1,0940-1,0951, 1,1011, 1,1048, 1,1091, 1,1132-1,1140, 1,1189-1,1191. El martes se publicará un único informe sobre la producción industrial en la Unión Europea, que probablemente no tenga mucha repercusión en el deseo del mercado de operar activamente.
1) La fuerza de la señal se considera por el tiempo que tardó en formarse (rebote o superación de un nivel). Cuanto menos tiempo tarde, más fuerte será la señal.
2) Si dos o más operaciones se abrieron cerca de cualquier nivel en señales falsas, todas las señales posteriores de este nivel deben ser ignoradas.
3) En flat, cualquier par puede formar muchas señales falsas o no formarlas en absoluto. Pero en cualquier caso, es mejor dejar de operar a las primeras señales de flat.
4) Las operaciones se abren en el período comprendido entre el inicio de la sesión europea y la mitad de la sesión americana, después de lo cual todas las operaciones deben cerrarse manualmente.
5) Dependiendo de las señales del indicador MACD, en el marco temporal de una hora conviene operar sólo si hay una buena volatilidad y una tendencia confirmada por una línea de tendencia o un canal de tendencia.
6) Si dos niveles están muy cerca el uno del otro (de 5 a 20 pips), deben ser considerados como soporte o resistencia.
7) Cuando se pasan 15 pips en la dirección correcta, se debe colocar un Stop Loss en el punto de equilibrio.
Los niveles de precios de soporte y resistencia son niveles que son objetivos para la apertura de compras o ventas. En torno a ellos se pueden colocar niveles de Take Profit.
Líneas rojas - canales o líneas de tendencia, que muestran la tendencia actual y en qué dirección es preferible operar ahora.
Indicador MACD(14,22,3) - histograma y línea de señal - un indicador auxiliar que también se puede utilizar como fuente de señales.
Los discursos e informes importantes (siempre incluidos en el calendario de noticias) pueden influir en gran medida en el movimiento de un par de divisas. Por lo tanto, durante su publicación debe operar con la mayor cautela posible o salir del mercado para evitar un brusco cambio del precio en contra del movimiento anterior.
Los principiantes que operan en el mercado de divisas deben recordar que todas las operaciones no pueden ser rentables. Desarrollar una estrategia clara y una gestión del capital es la clave del éxito en las operaciones a largo plazo.
¡Los informes analíticos de InstaForex lo mantendrá bien informado de las tendencias del mercado! Al ser un cliente de InstaForex, se le proporciona una gran cantidad de servicios gratuitos para una operación eficiente.


