 Permanecer
Condiciones de negociación
Products
Herramientas


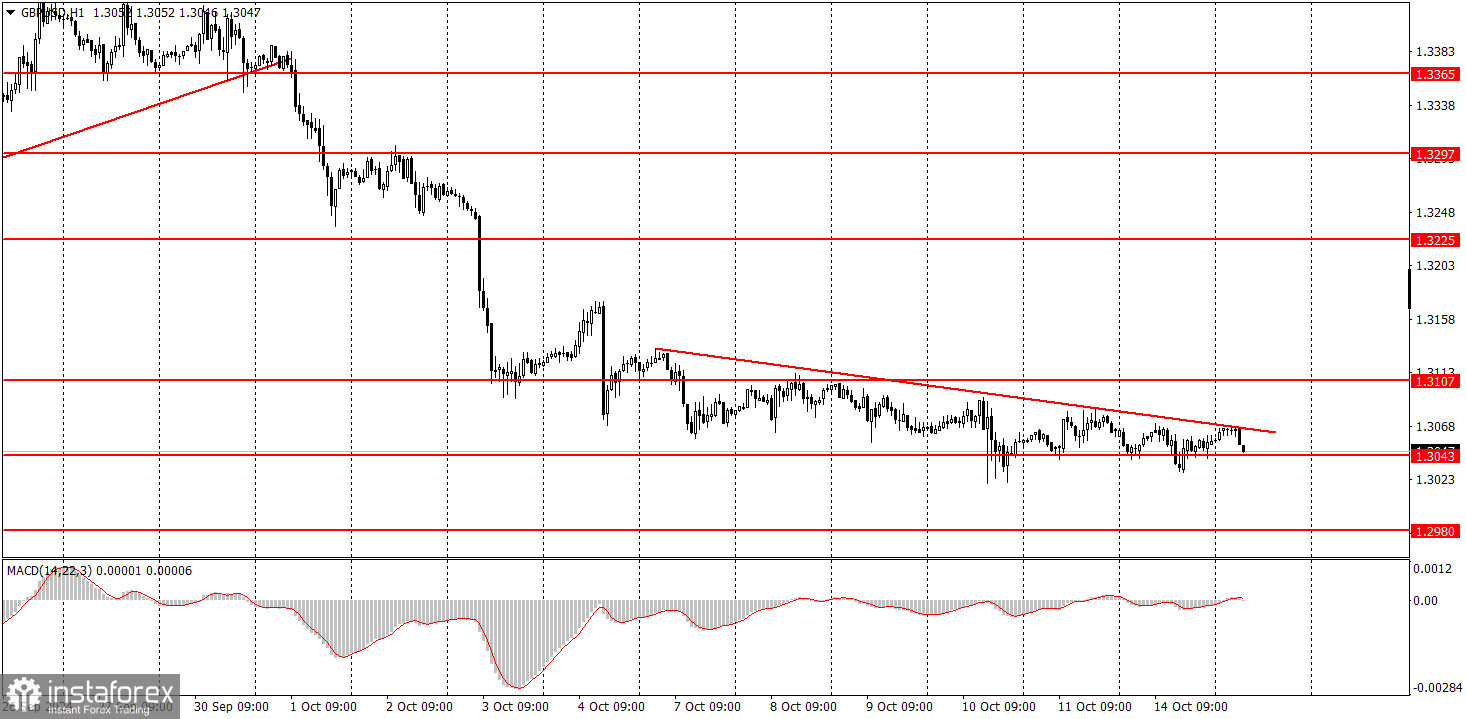
El par GBP/USD el lunes también gravitó a la baja, pero de hecho, ahora estamos observando un flat total. Sí, el precio se mueve lentamente a la baja, pero la volatilidad es mínima y el movimiento es muy «pegajoso». En general, es extremadamente difícil e incluso poco conveniente trabajarlo intradía. No obstante, la libra esterlina sigue cayendo, aunque, por ejemplo, ayer no hubo ninguna publicación macroeconómica ni ningún acontecimiento fundamental. Una consolidación por encima de la línea de tendencia convencional tampoco significará absolutamente nada. Todo el mundo espera una corrección por segunda semana consecutiva, pero la superación de la línea de tendencia en un movimiento casi de flat no significará que la libra vaya a corregirse ahora en 100-200 pips. A medio plazo, seguimos esperando sólo una caída del par. Esta semana habrá que tener en cuenta el informe de inflación del Reino Unido.
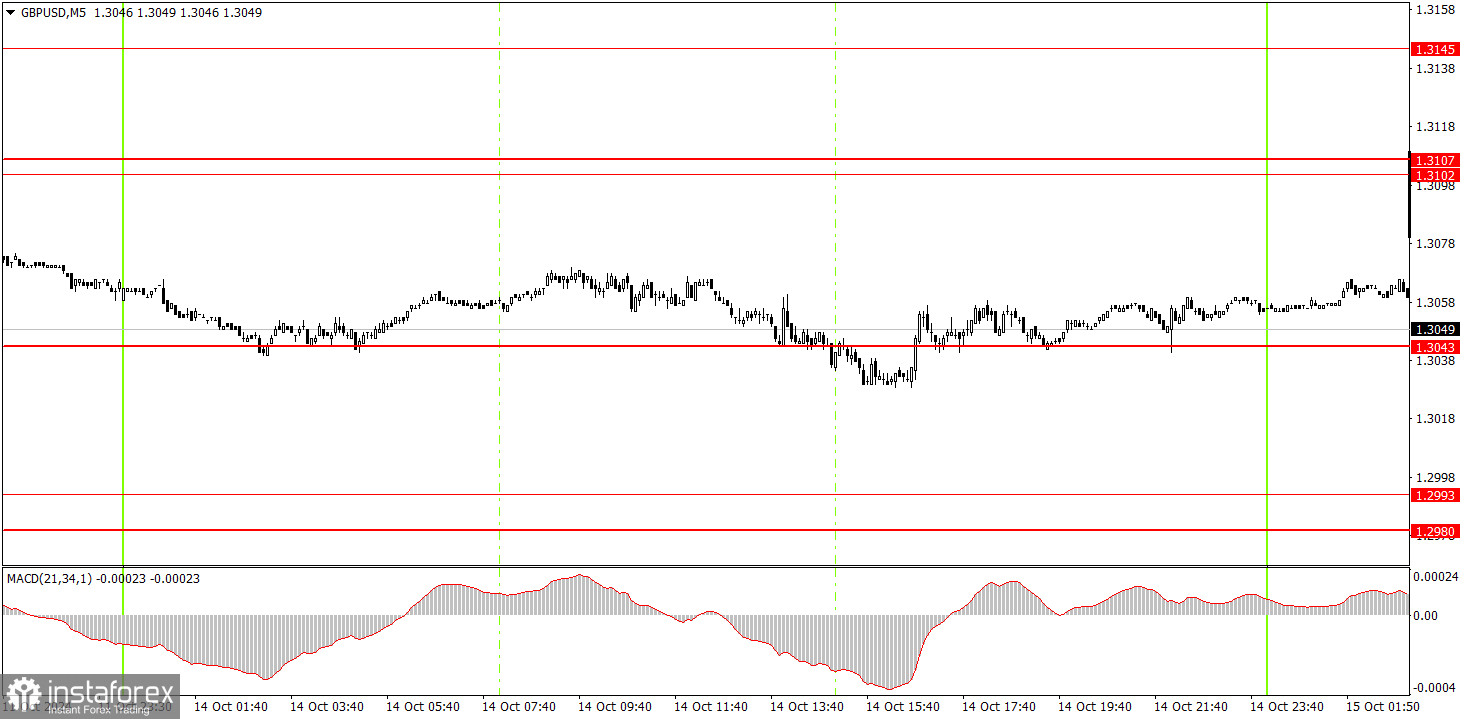
En el gráfico de 5 minutos del lunes se formaron varias señales de trading, pero no tenía sentido elaborarlas. El gráfico de 5 minutos muestra perfectamente que el precio se movió lateralmente durante todo el día. Cuando el mercado está en flat, los niveles, las líneas de tendencia y otras señales/indicadores técnicos no funcionan.
Análisis del par EUR/USD. El 15 de octubre. Cómo cambia el estado de ánimo del mercado.
Recomendaciones para operar y análisis de las operaciones con el par EUR/USD para el 15 de octubre.
Recomendaciones para operar y análisis de las operaciones con el par GBP/USD para el 15 de octubre.
En el gráfico de una hora, el par GBP/USD rompió la tendencia alcista y continúa cayendo. La moneda estadounidense ha comenzado su tan esperado crecimiento, pero hay que tener cuidado con la venta, ya que el par ni siquiera ha intentado corregirse en las últimas dos semanas. Sin embargo, en este momento no hay ni siquiera una mínima razón para esperar que el precio entre en corrección. A medio plazo, apoyamos plenamente la caída del par, ya que creemos que es la única opción legítima.
Para el martes, no deberíamos esperar otra cosa que un flat de nuevo. Nos gustaría recordar a los operadores novatos que la superación de líneas de tendencia o niveles en condiciones de flat son señales extremadamente débiles. Y ahora tenemos una volatilidad muy baja.
En el gráfico de 5 minutos se puede operar en 1,2913, 1,2980-1,2993, 1,3043, 1,3102-1,3107, 1,3145-1,3167, 1,3225, 1,3272, 1,3365, 1,3428-1,3440, 1,3488, 1,3537. El martes se publicarán las nóminas y el desempleo en el Reino Unido. Se trata de informes más o menos interesantes, pero es probable que persista el débil vector bajista, así como la baja volatilidad. El miércoles, el informe sobre la inflación en el Reino Unido, que puede afectar ligeramente al mercado.
1) La fuerza de la señal se considera por el tiempo que tardó en formarse (rebote o superación de un nivel). Cuanto menos tiempo tarde, más fuerte será la señal.
2) Si dos o más operaciones se abrieron cerca de cualquier nivel en señales falsas, todas las señales posteriores de este nivel deben ser ignoradas.
3) En flat, cualquier par puede formar muchas señales falsas o no formarlas en absoluto. Pero en cualquier caso, es mejor dejar de operar a las primeras señales de flat.
4) Las operaciones se abren en el período comprendido entre el inicio de la sesión europea y la mitad de la sesión americana, después de lo cual todas las operaciones deben cerrarse manualmente.
5) Dependiendo de las señales del indicador MACD, en el marco temporal de una hora conviene operar sólo si hay una buena volatilidad y una tendencia confirmada por una línea de tendencia o un canal de tendencia.
6) Si dos niveles están muy cerca el uno del otro (de 5 a 20 pips), deben ser considerados como soporte o resistencia.
7) Cuando se pasan 15 pips en la dirección correcta, se debe colocar un Stop Loss en el punto de equilibrio.
Los niveles de precios de soporte y resistencia son niveles que son objetivos para la apertura de compras o ventas. En torno a ellos se pueden colocar niveles de Take Profit.
Líneas rojas - canales o líneas de tendencia, que muestran la tendencia actual y en qué dirección es preferible operar ahora.
Indicador MACD(14,22,3) - histograma y línea de señal - un indicador auxiliar que también se puede utilizar como fuente de señales.
Los discursos e informes importantes (siempre incluidos en el calendario de noticias) pueden influir en gran medida en el movimiento de un par de divisas. Por lo tanto, durante su publicación debe operar con la mayor cautela posible o salir del mercado para evitar un brusco cambio del precio en contra del movimiento anterior.
Los principiantes que operan en el mercado de divisas deben recordar que todas las operaciones no pueden ser rentables. Desarrollar una estrategia clara y una gestión del capital es la clave del éxito en las operaciones a largo plazo.
¡Los informes analíticos de InstaForex lo mantendrá bien informado de las tendencias del mercado! Al ser un cliente de InstaForex, se le proporciona una gran cantidad de servicios gratuitos para una operación eficiente.


