 Permanecer
Condiciones de negociación
Products
Herramientas


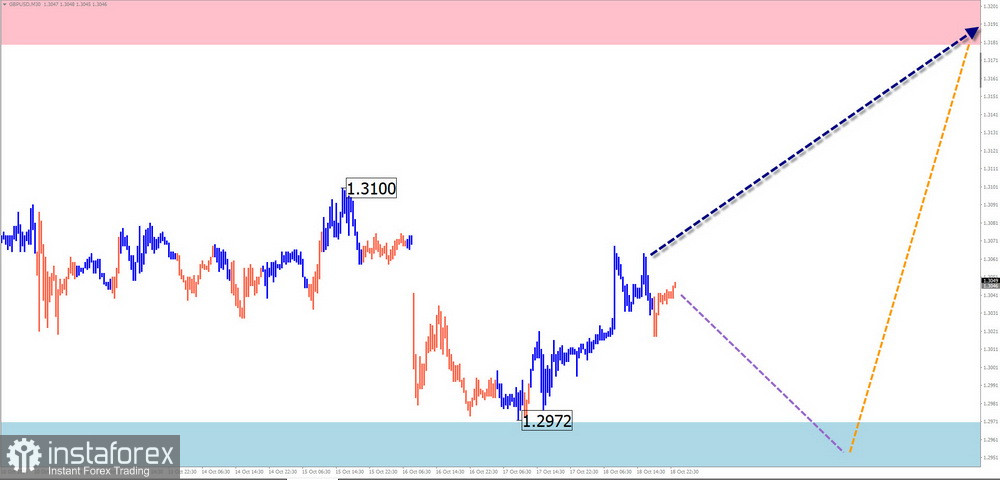
GBP/USD
Brief Analysis:
The upward wave structure for the British pound, current at the time of analysis, has been developing since early August. A complex correction in the form of a horizontal extended flat has been forming in the wave structure since the end of August. The correction is in its final phase but remains incomplete at the time of analysis.
Weekly Forecast:
In the upcoming week, the pound is expected to move within a range between nearby opposing zones. A bearish trend is more likely at the beginning of the week, with possible pressure on the estimated support zone, potentially breaching its lower boundary briefly. Towards the end of the week, a change in direction becomes more likely.
Potential Reversal Zones
Recommendations:
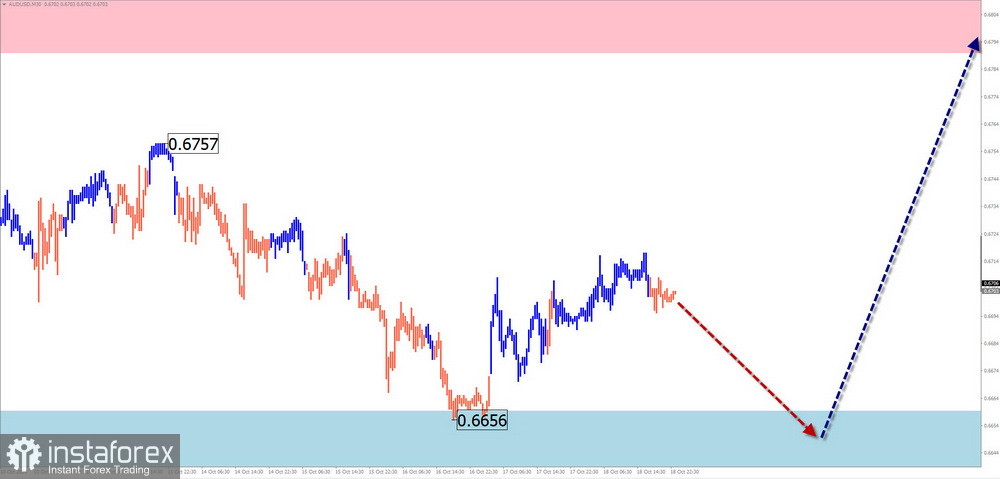
AUD/USD
Brief Analysis:
The Australian dollar continues its upward movement on the price chart. The downward segment began at the end of September. Within this segment, a flat correction has been forming over the last ten days and remains incomplete. The price is near the lower boundary of the price range that has formed over recent months.
Weekly Forecast:
For the next couple of days, the pair is expected to remain in a sideways range, forming conditions for a potential reversal. Pressure on the support level is possible. A reversal is expected near the end of the week. A move above the estimated resistance during the upcoming week is unlikely.
Potential Reversal Zones
Recommendations:
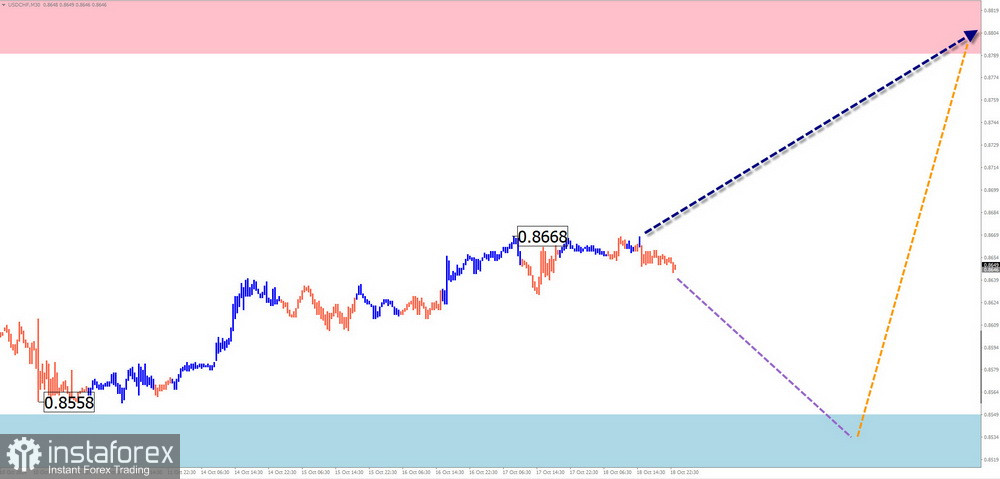
USD/CHF
Brief Analysis:
The current wave structure for the Swiss franc is upward, starting on August 5 and developing primarily in a sideways range. On a larger daily chart, this segment marks a trend change. The price has pushed through an intermediate resistance zone, turning it into support.
Weekly Forecast:
A continuation of the sideways movement is likely at the start of the week, with a possible decline towards the support zone. A reversal and resumption of the price rise are more likely toward the weekend. The resistance zone lies at the lower edge of a strong potential reversal zone on the daily timeframe.
Potential Reversal Zones
Recommendations:
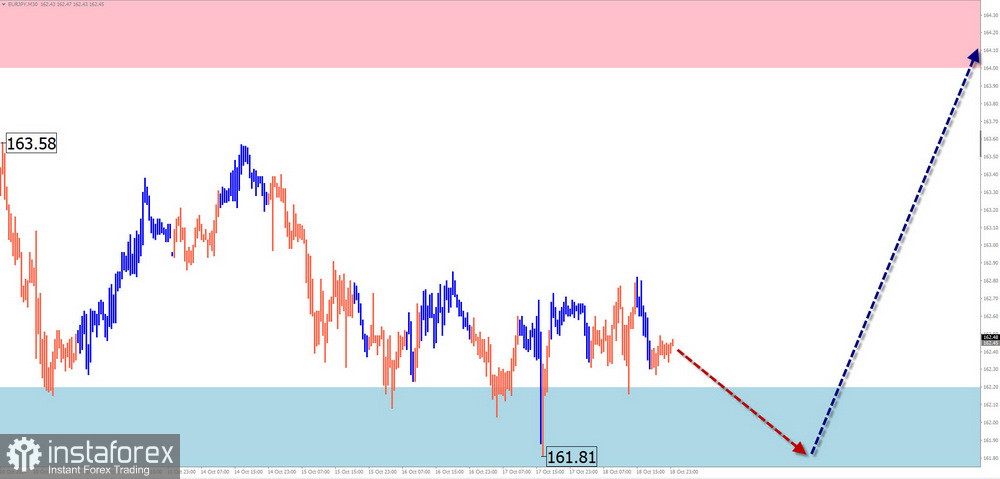
EUR/JPY
Brief Analysis:
Since August, the price movement of the EUR/JPY pair has been guided by an upward wave. Within its structure, an intermediate correction has been forming for three weeks as part of the final segment (C). The price has been moving sideways within a potential reversal zone on a larger timeframe.
Weekly Forecast:
At the start of the week, the pair is expected to continue its sideways movement along the calculated support boundaries. A reversal and the start of an upward price movement are likely afterward. The resistance zone indicates the most probable upper limit for the weekly movement of the pair.
Potential Reversal Zones
Recommendations:
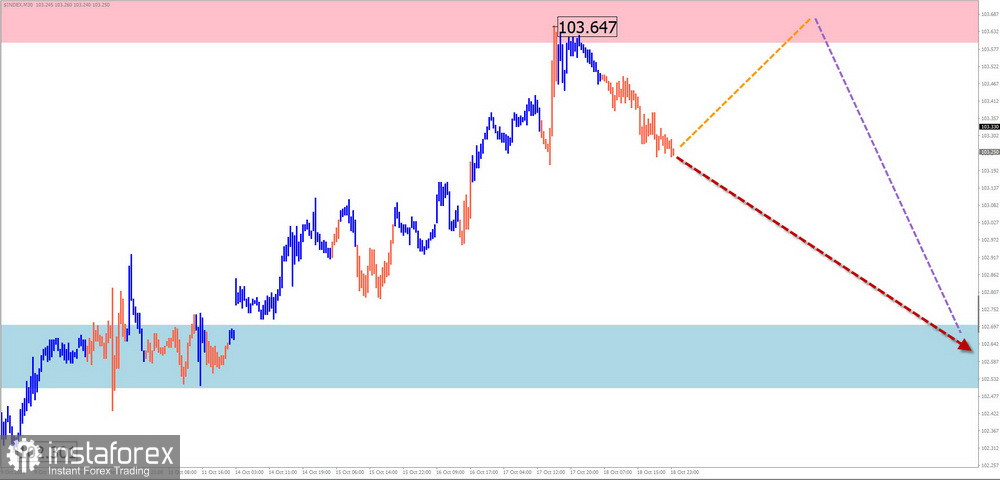
US Dollar Index
Brief Analysis:
After a month-long bullish trend, the dollar index has reached the boundaries of a broad potential reversal zone on a higher timeframe. Last week, the dollar index began a pullback from its upper boundary. Without an increase in the wave level of the current correction, further growth in the dollar index should not be expected.
Weekly Forecast:
Throughout the upcoming week, the dollar index is expected to fluctuate between nearby support and resistance zones. A sideways trend is likely at the beginning of the week, with a potential upward move. A shift in direction and resumption of the decline are expected towards the weekend. A breakthrough of the calculated zones within the week is unlikely.
Potential Reversal Zones
Recommendations:
Note: In simplified wave analysis (SWA), all waves consist of three parts (A-B-C). The analysis focuses on the last unfinished wave on each timeframe. Dashed lines indicate expected movements.
Attention: The wave algorithm does not consider the duration of price movements over time!
¡Los informes analíticos de InstaForex lo mantendrá bien informado de las tendencias del mercado! Al ser un cliente de InstaForex, se le proporciona una gran cantidad de servicios gratuitos para una operación eficiente.


