 Permanecer
Condiciones de negociación
Products
Herramientas


On Tuesday, the EUR/USD currency pair once again attempted to maintain its local upward trend, which is part of a broader sideways movement observed on the daily timeframe. However, it failed to break out of the flat. There were no fundamental reasons for a new euro rally on either Monday or Tuesday, as the economic background was nearly absent except for a few minor events. The pair continues to trade within a narrow range, with the trendline below providing strong support. However, this support cannot hold the euro indefinitely. We still anticipate that this trendline will be breached, leading to a decline in the European currency. It is likely that the British pound will also fall alongside the euro.
From a technical standpoint, nothing changed on Tuesday. We observed a local upward trend, and it is possible that we may see a similar downward movement next. Until the correction on the daily timeframe is complete, multiple such trends may occur on the hourly timeframe. The exact timing of the correction's completion is uncertain, but it's essential to remember that any rally in the euro is merely a correction.
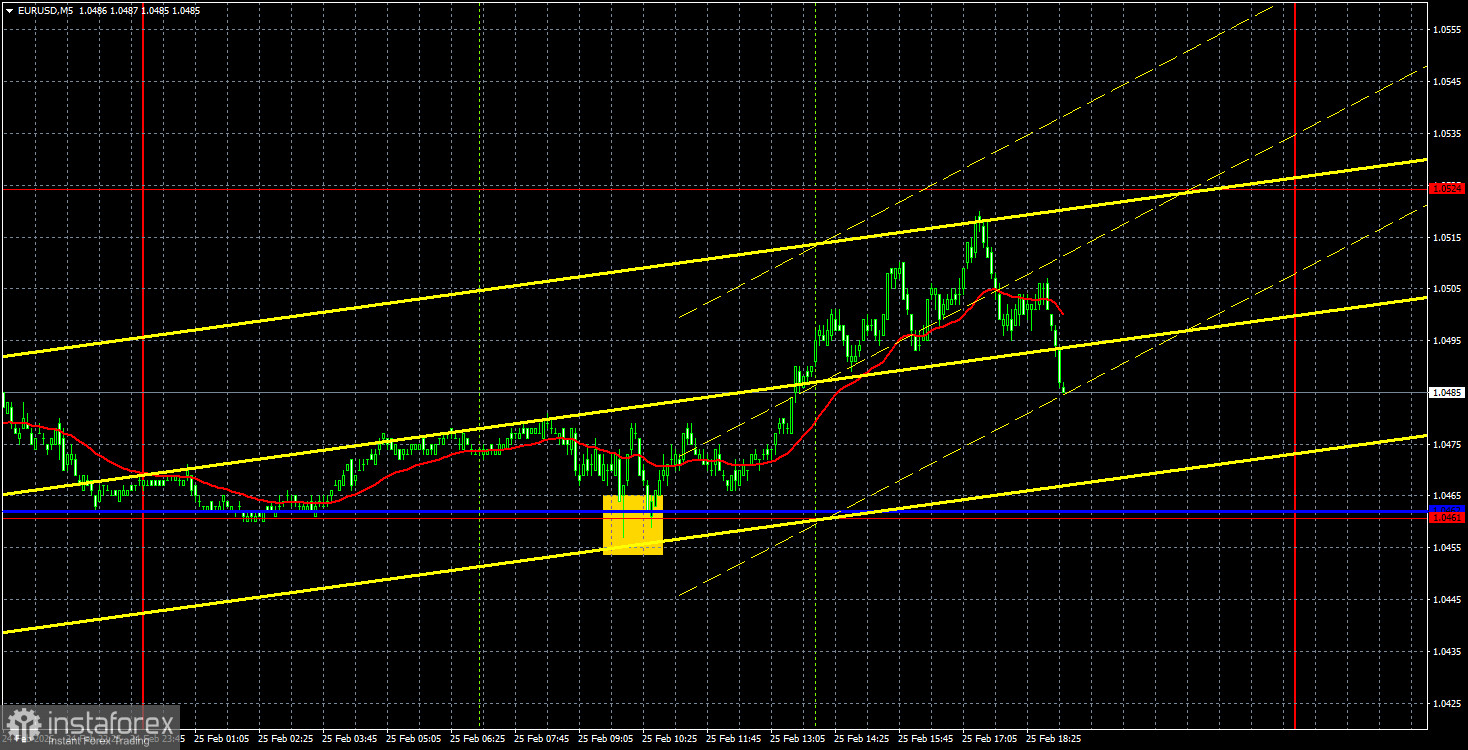
Tuesday provided traders with a fairly good trading signal. There was only one signal, but it was quite precise. During the European trading session, the price clearly bounced off the 1.0461 level and the nearby Kijun-sen line. Following this, the price moved up by approximately 45 pips. Unfortunately, it did not reach the nearest target level of 1.0524, but traders had ample time and opportunities to close the trade in profit.
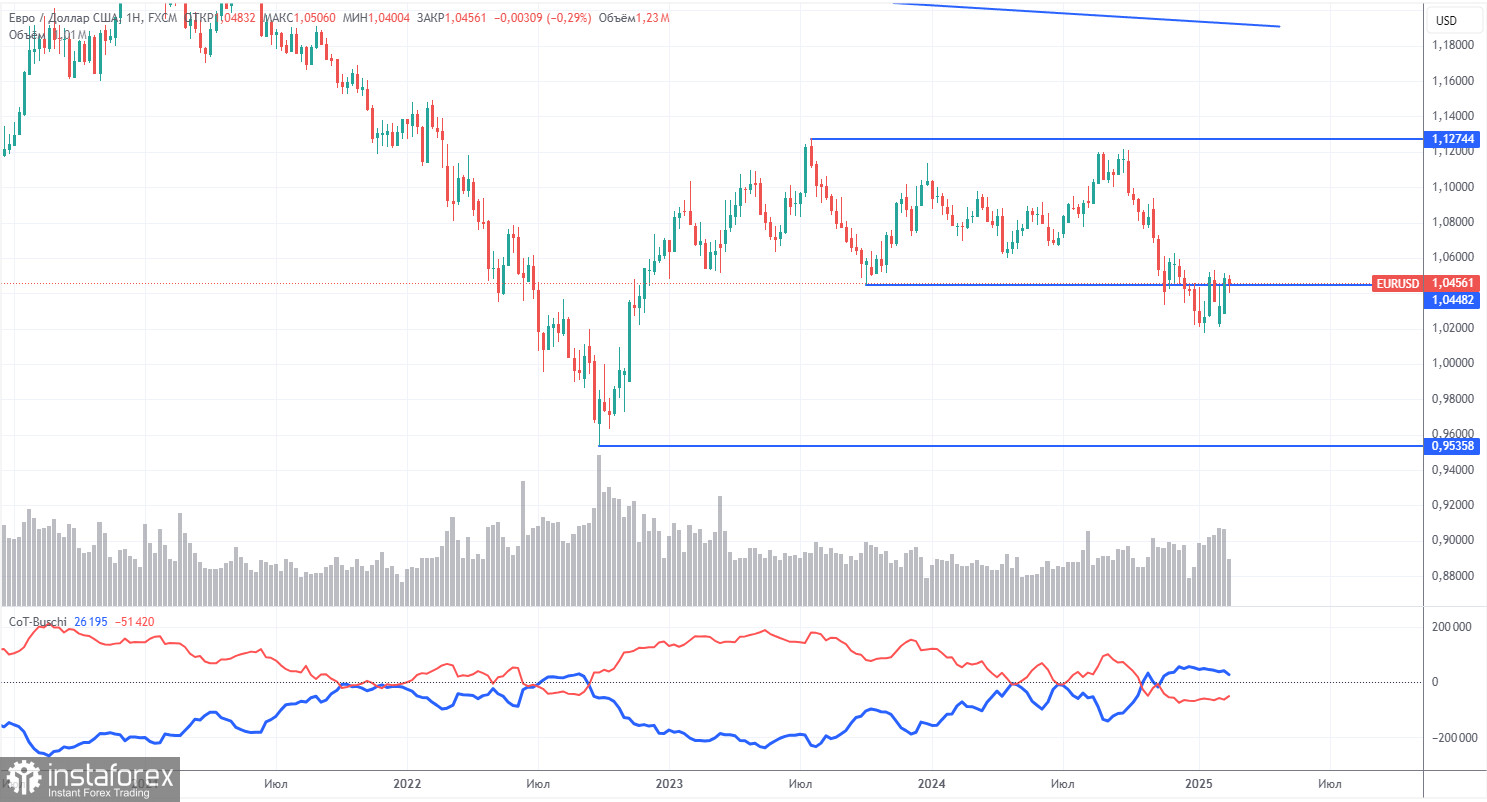
The latest COT report, dated February 18, indicates that the net position of non-commercial traders remained bullish for an extended period. However, bears have recently gained dominance in the market. Three months ago, there was a significant increase in the number of short positions taken by professional traders, resulting in a negative net position for the first time in a long while. This trend suggests that the euro is being sold more frequently than it is being purchased, leading to a prevailing bearish sentiment.
Currently, there are no fundamental factors supporting a strengthening of the euro. The upward movement observed in the weekly timeframe is minimal and appears to be a mere correction. The currency pair may continue to correct for several weeks or even months; however, this does not alter the long-term downtrend that has persisted for 16 years.
At present, the red and blue lines in the COT report have crossed and switched positions, indicating a bearish trend in the market. During the most recent reporting week, the number of long positions in the "Non-commercial" group increased by 4,700, while short positions decreased by 8,200. As a result, the net position grew by 12,900 contracts; nonetheless, this change does not significantly impact the overall market sentiment.
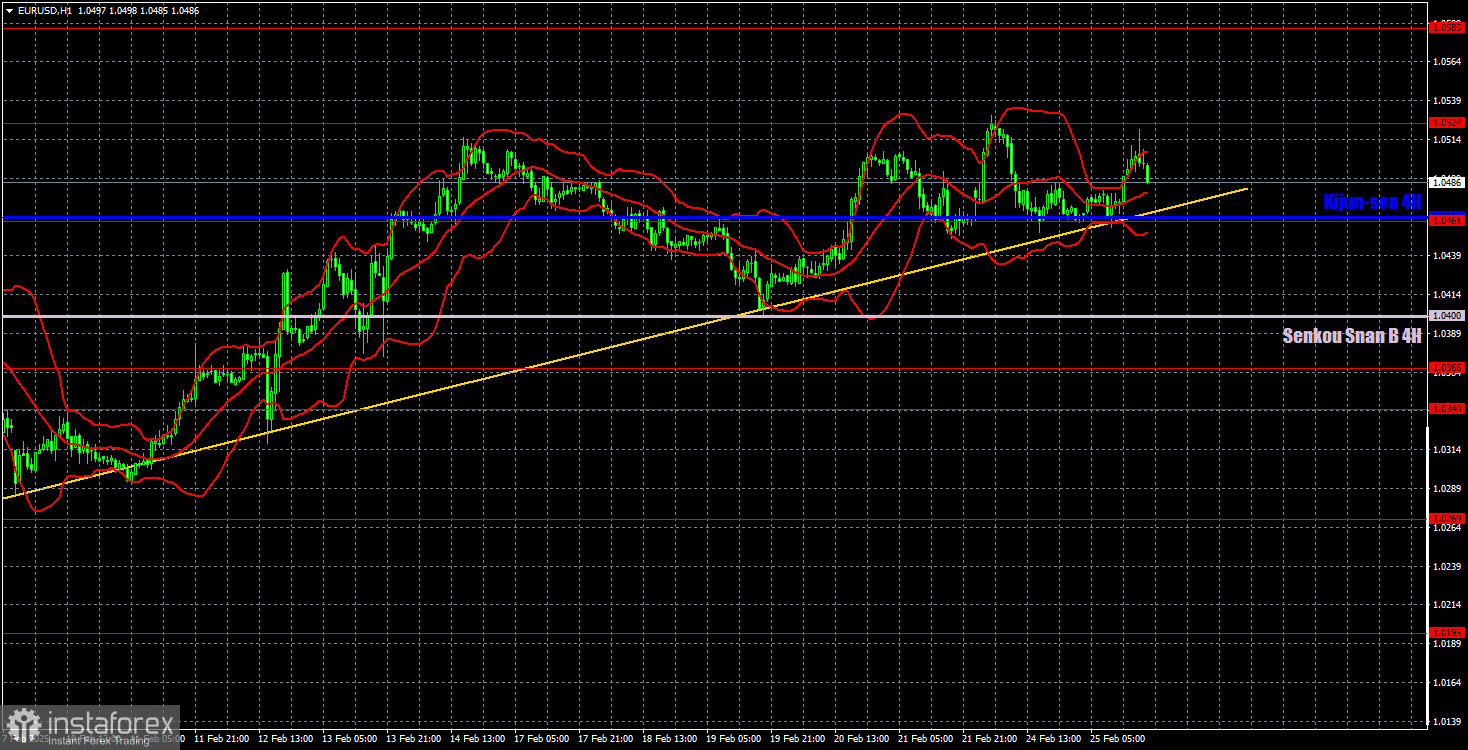
On the hourly timeframe, the pair continues its local upward trend. However, the decline will likely resume in the medium term, as the Federal Reserve is likely to cut interest rates only once or twice in 2025, while the European Central Bank is expected to implement more rate cuts. In the short term, we may see one or two more upward trends, as the correction on the daily timeframe could take a long time and be quite complex. There are still no substantial reasons for the euro to rise, and its occasional gains are 80% technical.
For February 26, the following levels are key for trading: 1.0124, 1.0195, 1.0269, 1.0340-1.0366, 1.0461, 1.0524, 1.0585, 1.0658-1.0669, 1.0757, 1.0797, 1.0843, as well as the Senkou Span B line (1.0400) and the Kijun-sen line (1.0464). The Ichimoku indicator lines may shift throughout the day, so this should be considered when identifying trading signals. Don't forget to set a Stop Loss to break even if the price moves 15 points in the right direction—this helps protect against potential losses if the signal turns out to be false.
On Tuesday, the Consumer Confidence Index in Germany is scheduled to be released as part of the Eurozone calendar; however, there are no significant events planned for the day. Similarly, no major reports are expected for the third trading day of the week. As a result, the currency pair may remain confined within the range of 1.0461 to 1.0524. However, a break below the trendline would indicate a strong signal for a potential further decline.
¡Los informes analíticos de InstaForex lo mantendrá bien informado de las tendencias del mercado! Al ser un cliente de InstaForex, se le proporciona una gran cantidad de servicios gratuitos para una operación eficiente.


