empty
 
 
Está a punto de salir de
www.instaforex.eu >
un sitio web operado por
INSTANT TRADING EU LTD
Abrir cuenta

24.03.202514:22 Forex Analysis & Reviews: Weekly Technical Analysis for March 24–29: EUR/USD Currency Pair

Esta información se proporciona a clientes minoristas y profesionales como parte de comunicación de marketing. No contiene y no debe interpretarse como asesoramiento o recomendación de inversión o una oferta o solicitud para participar en cualquier transacción o estrategia en instrumentos financieros. El desempeño pasado no garantiza o predice el desempeño futuro. Instant Trading EU Ltd. no asume ninguna representación ni responsabilidad sobre la precisión o integridad de la información proporcionada, o cualquier pérdida que surja de cualquier inversión basada en el análisis, pronóstico u otra información proporcionada por un empleado de la Compañía o de otra manera. El descargo de responsabilidad completo está disponible aquí.

Trend Analysis (Fig. 1)

This week, the market may start moving upward from the level of 1.0815 (closing of the last weekly candle), targeting 1.0957 – the upper fractal (blue dashed line). Upon testing this level, the price may continue rising toward 1.1002 – the historical resistance level (light blue dashed line).

Exchange Rates 24.03.2025 analysis

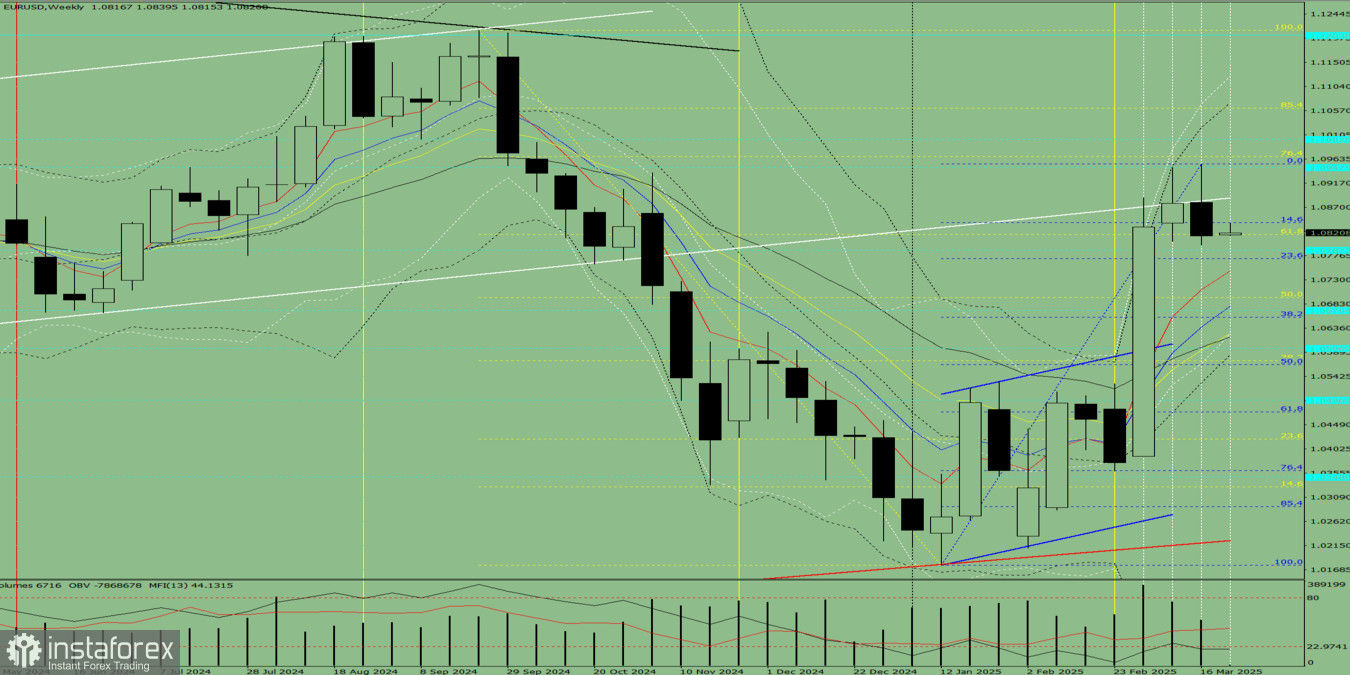
Fig. 1 (Weekly Chart)

Comprehensive Analysis:

  • Indicator analysis – upward
  • Fibonacci levels – upward
  • Volume – upward
  • Candlestick analysis – upward
  • Trend analysis – upward
  • Bollinger Bands – upward
  • Monthly chart – upward

Conclusion based on the comprehensive analysis: upward movement.

Overall forecast for the EUR/USD weekly candle: the price will most likely show an upward trend throughout the week, with no lower shadow on the weekly white candle (Monday – upward movement) and a potential upper shadow (Friday – pullback).

Alternative scenario: the pair may start moving upward from the level of 1.0815 (closing of the last weekly candle), targeting 1.0957 – the upper fractal (blue dashed line). Upon testing this level, the price may pull back downward to 1.0890 – resistance line (bold white line).

Desarrollado por un Stefan Doll
experto de análisis de InstaForex
© 2007-2025

Abra una cuenta de operaciones

¡Los informes analíticos de InstaForex lo mantendrá bien informado de las tendencias del mercado! Al ser un cliente de InstaForex, se le proporciona una gran cantidad de servicios gratuitos para una operación eficiente.


Usted está ahora saliendo de www.instaforex.eu, un sitio web operado por INSTANT TRADING EU LTD
¿No puede hablar ahora mismo?
Ingrese su pregunta en el chat.
Widget callback

Turn "Do Not Track" off