 Permanecer
Condiciones de negociación
Products
Herramientas


On Tuesday, the EUR/USD currency pair pulled back slightly, which can be considered a purely technical correction. Yesterday — and generally — the dollar still has no real reason to strengthen, given the current fundamental backdrop and how the market interprets it. Right now, the market only responds to news about the trade war. If there's news — the dollar falls. If there's no news, it usually moves sideways or stays flat, as we've seen over the past few days.
We still believe the market ignores many dollar-supportive factors because the U.S. economy remains stronger than the European or British economies. Yes, its outlook under Trump is uncertain, but things aren't any better in Europe or the UK since the trade war also affects them. However, the market seems to respond directly to Trump's protectionist policies by selling the dollar, U.S. stocks, and bonds.
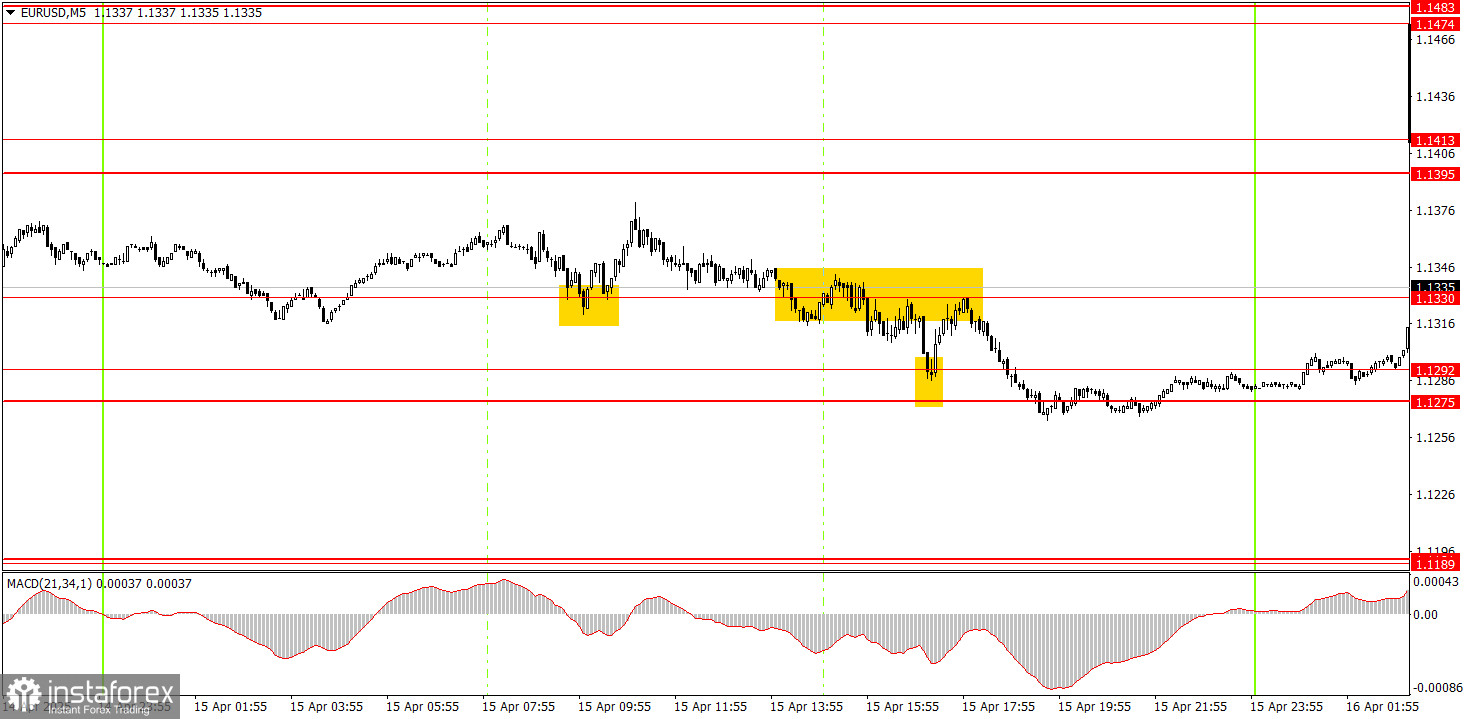
Several trading signals were formed on Tuesday's 5-minute time frame, but the movements remained random and chaotic. We've mentioned this several times before. Of course, signals still occur, but they're not playing out reliably, and the pair only shows good movement when Trump introduces new tariffs or raises existing ones.
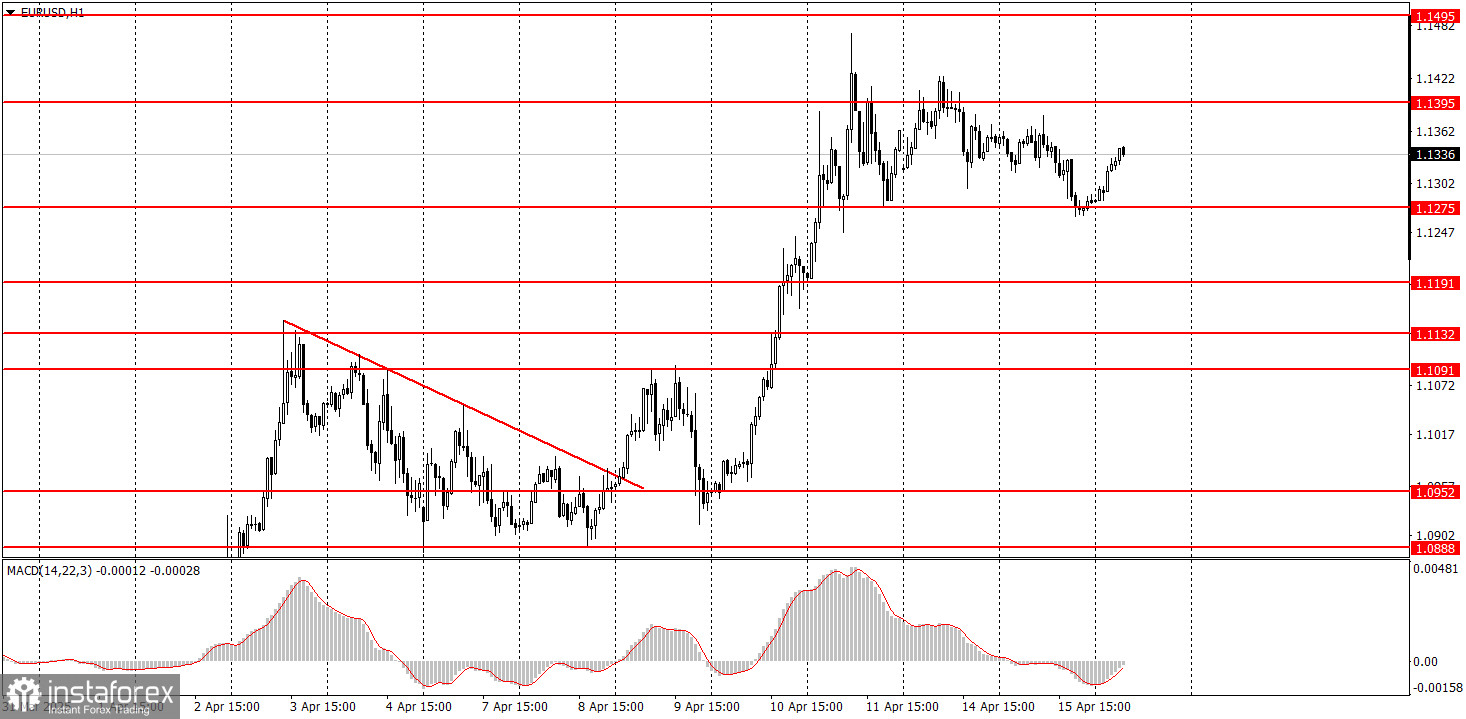
The EUR/USD pair continues its upward trend on the hourly time frame. It is unknown how long this trend will last, as no one knows how many additional tariffs Trump may impose. Escalation of the trade war is entirely possible, as many countries are planning reciprocal actions — something the U.S. president is unlikely to appreciate. Because of Trump's "concessions," the dollar hasn't been able to strengthen, and now the focus is on the U.S.–China trade confrontation, where there are no positive developments.
On Wednesday, the markets will likely remain in a state of panic. We won't attempt to forecast price movements since trade-related news can drop anytime. This means the price could suddenly spike in either direction.
On the 5-minute TF, the levels of 1.0797-1.0804, 1.0859-1.0861, 1.0888-1.0896, 1.0940-1.0952, 1.1011, 1.1091, 1.1132-1.1140, 1.1189-1.1191, 1.1275-1.1292, 1.1330, 1.1395-1.1413, 1.1474-1.1483 should be considered. On Wednesday, the eurozone will publish the second inflation estimate, and the U.S. will release reports on retail sales and industrial production. These are relatively secondary indicators, even if the inflation report looks significant at first glance. Still, this is only a second estimate — and the euro continues to rise even amid ongoing ECB monetary easing.
Support and Resistance Levels: These are target levels for opening or closing positions and can also serve as points for placing Take Profit orders.
Red Lines: Channels or trendlines indicating the current trend and the preferred direction for trading.
MACD Indicator (14,22,3): A histogram and signal line used as a supplementary source of trading signals.
Important Events and Reports: Found in the economic calendar, these can heavily influence price movements. Exercise caution or exit the market during their release to avoid sharp reversals.
Forex trading beginners should remember that not every trade will be profitable. Developing a clear strategy and practicing proper money management are essential for long-term trading success.
¡Los informes analíticos de InstaForex lo mantendrá bien informado de las tendencias del mercado! Al ser un cliente de InstaForex, se le proporciona una gran cantidad de servicios gratuitos para una operación eficiente.


