
 Permanecer

Los patrones son modelos gráficos que se forman en el gráfico mediante el precio. Según uno de los postulados del análisis técnico, la historia (movimiento del precio) se repite. Esto quiere decir que los movimientos del precio a menudo son similares en las mismas situaciones que hacen posible pronosticar el futuro desarrollo de la situación con una alta probabilidad.
Los patrones relevantes de InstaForex son un servicio fácil de utilizar que permiten que conozca los últimos cambios en el mercado y reaccione a las pistas del mercado a tiempo. En nuestro servicio, siempre encontrará los últimos y más importantes patrones en cualquier par y en cualquier marco de tiempo.
was formed on 26.03 at 08:34:55 (UTC+0)
signal strength 1 of 5
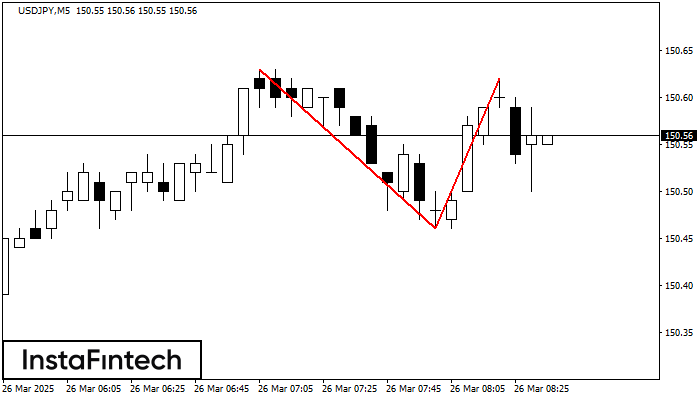
The Double Top reversal pattern has been formed on USDJPY M5. Characteristics: the upper boundary 150.63; the lower boundary 150.46; the width of the pattern is 16 points. Sell trades are better to be opened below the lower boundary 150.46 with a possible movements towards the 150.31 level.
The M5 and M15 time frames may have more false entry points.
Vea asimismo
- All
- Double Top
- Flag
- Head and Shoulders
- Pennant
- Rectangle
- Triangle
- Triple top
- All
- #AAPL
- #AMZN
- #EBAY
- #FB
- #GOOG
- #INTC
- #KO
- #MA
- #MCD
- #MSFT
- #NTDOY
- #PEP
- #TSLA
- #TWTR
- AUDCAD
- AUDCHF
- AUDJPY
- AUDUSD
- EURCAD
- EURCHF
- EURGBP
- EURJPY
- EURNZD
- EURRUB
- EURUSD
- GBPAUD
- GBPCHF
- GBPJPY
- GBPUSD
- GOLD
- NZDCAD
- NZDCHF
- NZDJPY
- NZDUSD
- SILVER
- USDCAD
- USDCHF
- USDJPY
- USDRUB
- All
- M5
- M15
- M30
- H1
- D1
- All
- Buy
- Sale
- All
- 1
- 2
- 3
- 4
- 5

The Bullish pennant signal – Trading instrument NZDCAD M5, continuation pattern. Forecast: it is possible to set up a buy position above the pattern’s high of 0.8304, with the prospect
The M5 and M15 time frames may have more false entry points.
Open chart in a new window
The Bullish pennant graphic pattern has formed on the NZDUSD M5 instrument. This pattern type falls under the category of continuation patterns. In this case, if the quote can breaks
The M5 and M15 time frames may have more false entry points.
Open chart in a new window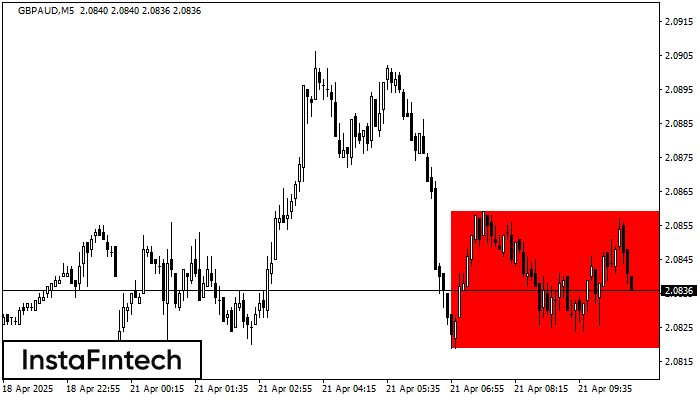
According to the chart of M5, GBPAUD formed the Bearish Rectangle. The pattern indicates a trend continuation. The upper border is 2.0859, the lower border is 2.0819. The signal means
The M5 and M15 time frames may have more false entry points.
Open chart in a new window

