
 Permanecer


Los patrones son modelos gráficos que se forman en el gráfico mediante el precio. Según uno de los postulados del análisis técnico, la historia (movimiento del precio) se repite. Esto quiere decir que los movimientos del precio a menudo son similares en las mismas situaciones que hacen posible pronosticar el futuro desarrollo de la situación con una alta probabilidad.
Los patrones relevantes de InstaForex son un servicio fácil de utilizar que permiten que conozca los últimos cambios en el mercado y reaccione a las pistas del mercado a tiempo. En nuestro servicio, siempre encontrará los últimos y más importantes patrones en cualquier par y en cualquier marco de tiempo.
was formed on 27.03 at 17:40:23 (UTC+0)
signal strength 1 of 5
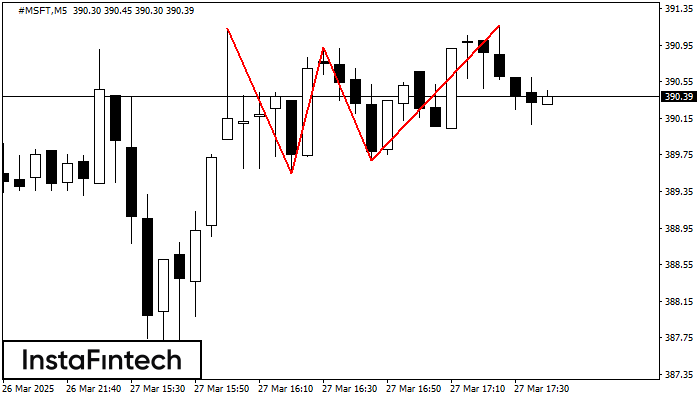
The Triple Top pattern has formed on the chart of the #MSFT M5 trading instrument. It is a reversal pattern featuring the following characteristics: resistance level -3, support level -14, and pattern’s width 158. Forecast If the price breaks through the support level 389.55, it is likely to move further down to 390.77.
The M5 and M15 time frames may have more false entry points.
- All
- Double Top
- Flag
- Head and Shoulders
- Pennant
- Rectangle
- Triangle
- Triple top
- All
- #AAPL
- #AMZN
- #EBAY
- #FB
- #GOOG
- #INTC
- #KO
- #MA
- #MCD
- #MSFT
- #NTDOY
- #PEP
- #TSLA
- #TWTR
- AUDCAD
- AUDCHF
- AUDJPY
- AUDUSD
- EURCAD
- EURCHF
- EURGBP
- EURJPY
- EURNZD
- EURRUB
- EURUSD
- GBPAUD
- GBPCHF
- GBPJPY
- GBPUSD
- GOLD
- NZDCAD
- NZDCHF
- NZDJPY
- NZDUSD
- SILVER
- USDCAD
- USDCHF
- USDJPY
- USDRUB
- All
- M5
- M15
- M30
- H1
- D1
- All
- Buy
- Sale
- All
- 1
- 2
- 3
- 4
- 5

Secondo il grafico di M5, GBPAUD ha formato il modello Triangolo Simmetrico Rialzista. Il confine inferiore del modello tocca le coordinate 2.0704/2.0775 mentre il confine superiore attraversa 2.0831/2.0775
I time frame M5 e M15 possono avere più punti di ingresso falsi.
Open chart in a new window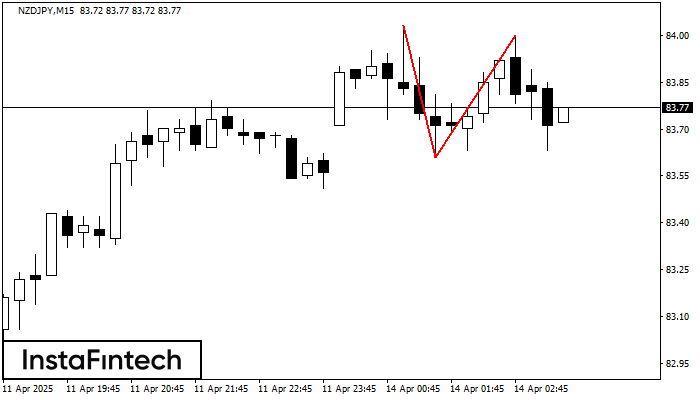
Il modello di inversione Doppio Massimo è stato formato su NZDJPY M15. Caratteristiche: il confine superiore 84.03; il confine inferiore 83.61; la larghezza del modello è di 39 punti
I time frame M5 e M15 possono avere più punti di ingresso falsi.
Open chart in a new window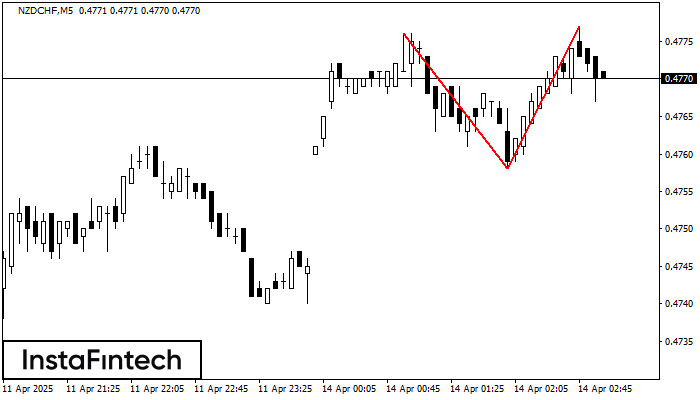
Il modello di inversione Doppio Massimo è stato formato su NZDCHF M5. Caratteristiche: il confine superiore 0.4776; il confine inferiore 0.4758; la larghezza del modello è di 19 punti
I time frame M5 e M15 possono avere più punti di ingresso falsi.
Open chart in a new window


